
Real-Time Subseasonal Hydroclimate Forecasts (HS2S)
This page provides weekly, real-time forecasts for Germany. Using ECMWF IFS ensembles and the mHM, the hydrological forecasting system (HS2S) updates automatically and delivers probabilistic outlooks of soil moisture, and streamflow at 1,500+ CAMELS-DE catchments.

The figure shows 1-km Soil Moisture Index (SMI) forecasts for Germany, including uncertainty across the ensemble. From left to right, the panels display the driest ensemble member (worst-case drought), the ensemble mean, and the wettest ensemble member (best-case). Results are shown for 1-week lead time (top row) and 2-week lead time (bottom row).
Uncertainty is derived from 51 real-time ensemble members, calibrated using an M-Climate reference ensemble of 1,980 pooled reforecast members (20 years × 11 members × 9 consecutive start dates).
Gridded reference data (HYRAS) and station observations were retrieved from the DWD Open Data portal and are provided under the Creative Commons Attribution 4.0 International licence (CC BY 4.0). ECMWF licensing and attribution information is provided at the bottom of this page.

The figure shows an experimental 1-km streamflow (river discharge) forecast for Germany, including ensemble uncertainty.
From left to right, panels show the lowest-flow ensemble member, the ensemble median (typical conditions), and the highest-flow ensemble member. Forecasts are produced with an ECMWF-IFS → mHM ensemble workflow for CAMELS-DE catchments and are intended for research and demonstration (not an operational warning product).
Uncertainty is derived from 51 real-time ensemble members, calibrated using an M-Climate reference ensemble of 1,980 pooled reforecast members (20 years × 11 members × 9 consecutive start dates).Hydrological initial conditions (model states) are generated using meteorological forcing from DWD (German Weather Service) Open Data.
Meteorological reference data (e.g., HYRAS) and station observations were retrieved from the DWD Open Data portal and are provided under the Creative Commons Attribution 4.0 International licence (CC BY 4.0). ECMWF licensing and attribution information is provided on this page.
Atmospheric Forecasts and Climatology
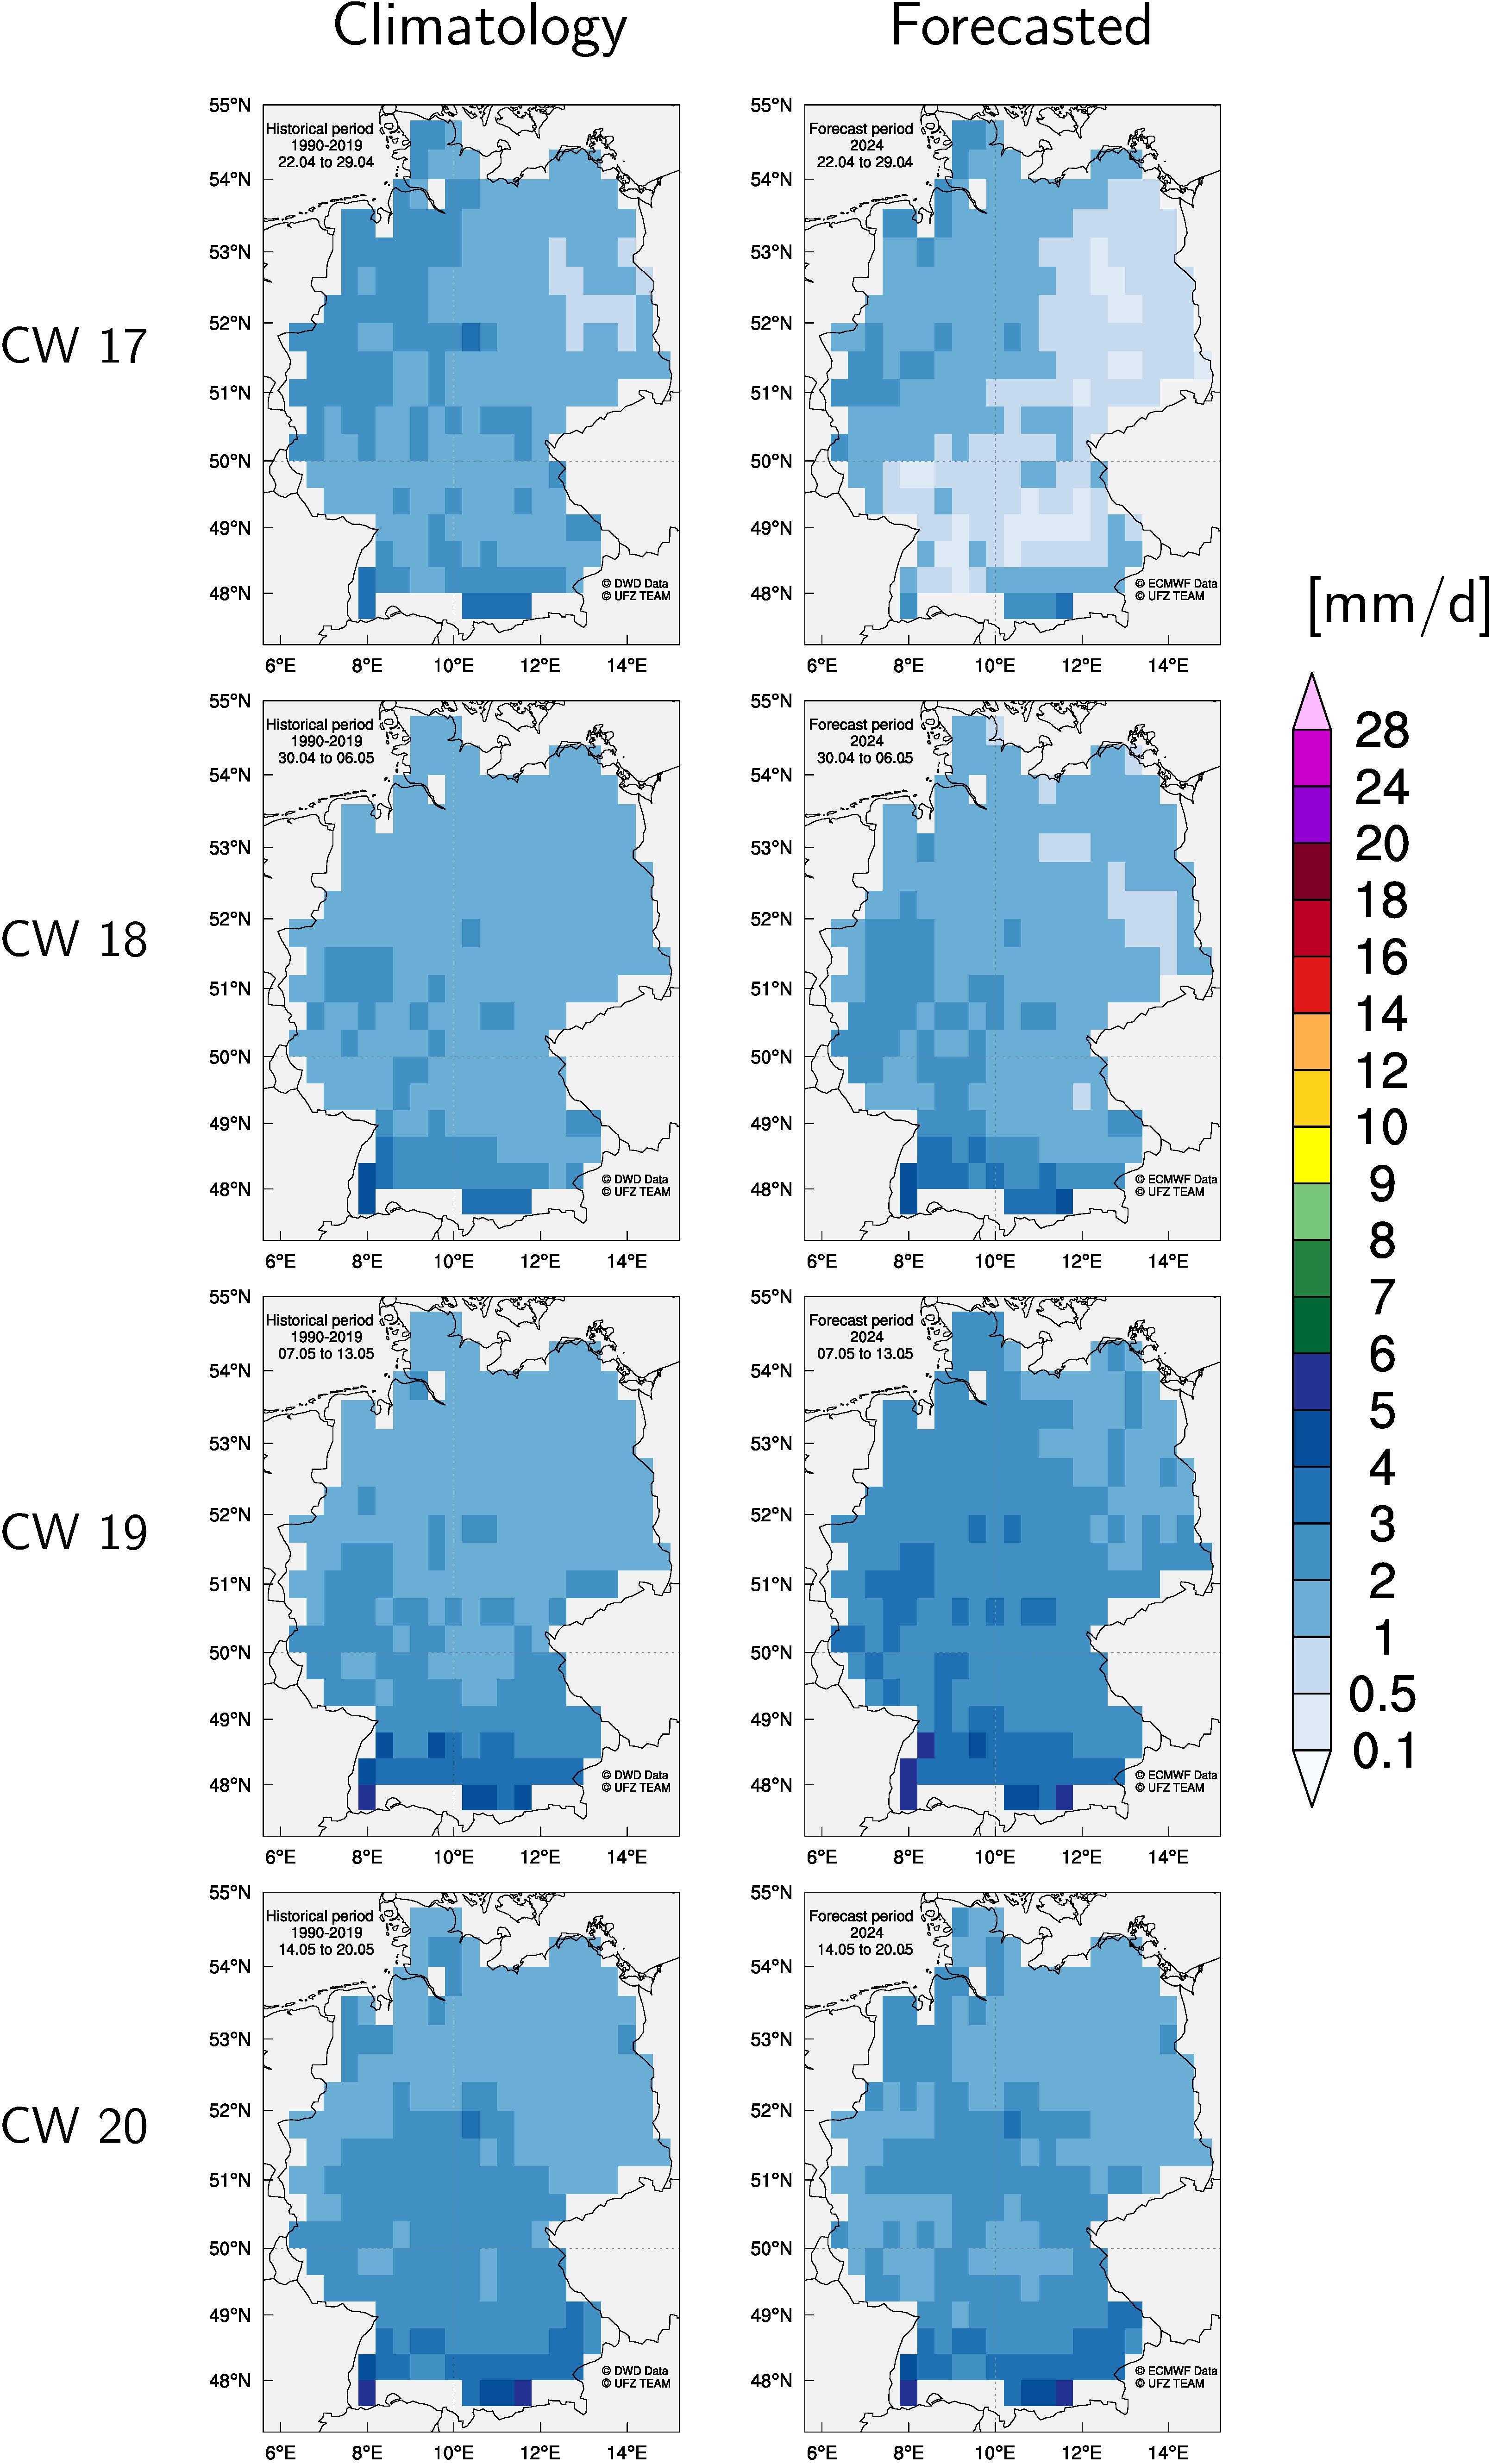
This figure provides climatological averages of precipitation, which are the means of weekly values of cumulative precipitation of the given calendar week computed over the 1990-2019 historical period based on DWD data. For the same calendar week, cumulative precipitation forecast from ECMWF Ensemble Extended is bias corrected and shown on the right. One can then compare climatological long-term averages with precipitation forecasts the upcoming weeks. DWD station data are interpolated using the External Drift Kriging (EDK) developed by Samaniego et al. (2011).
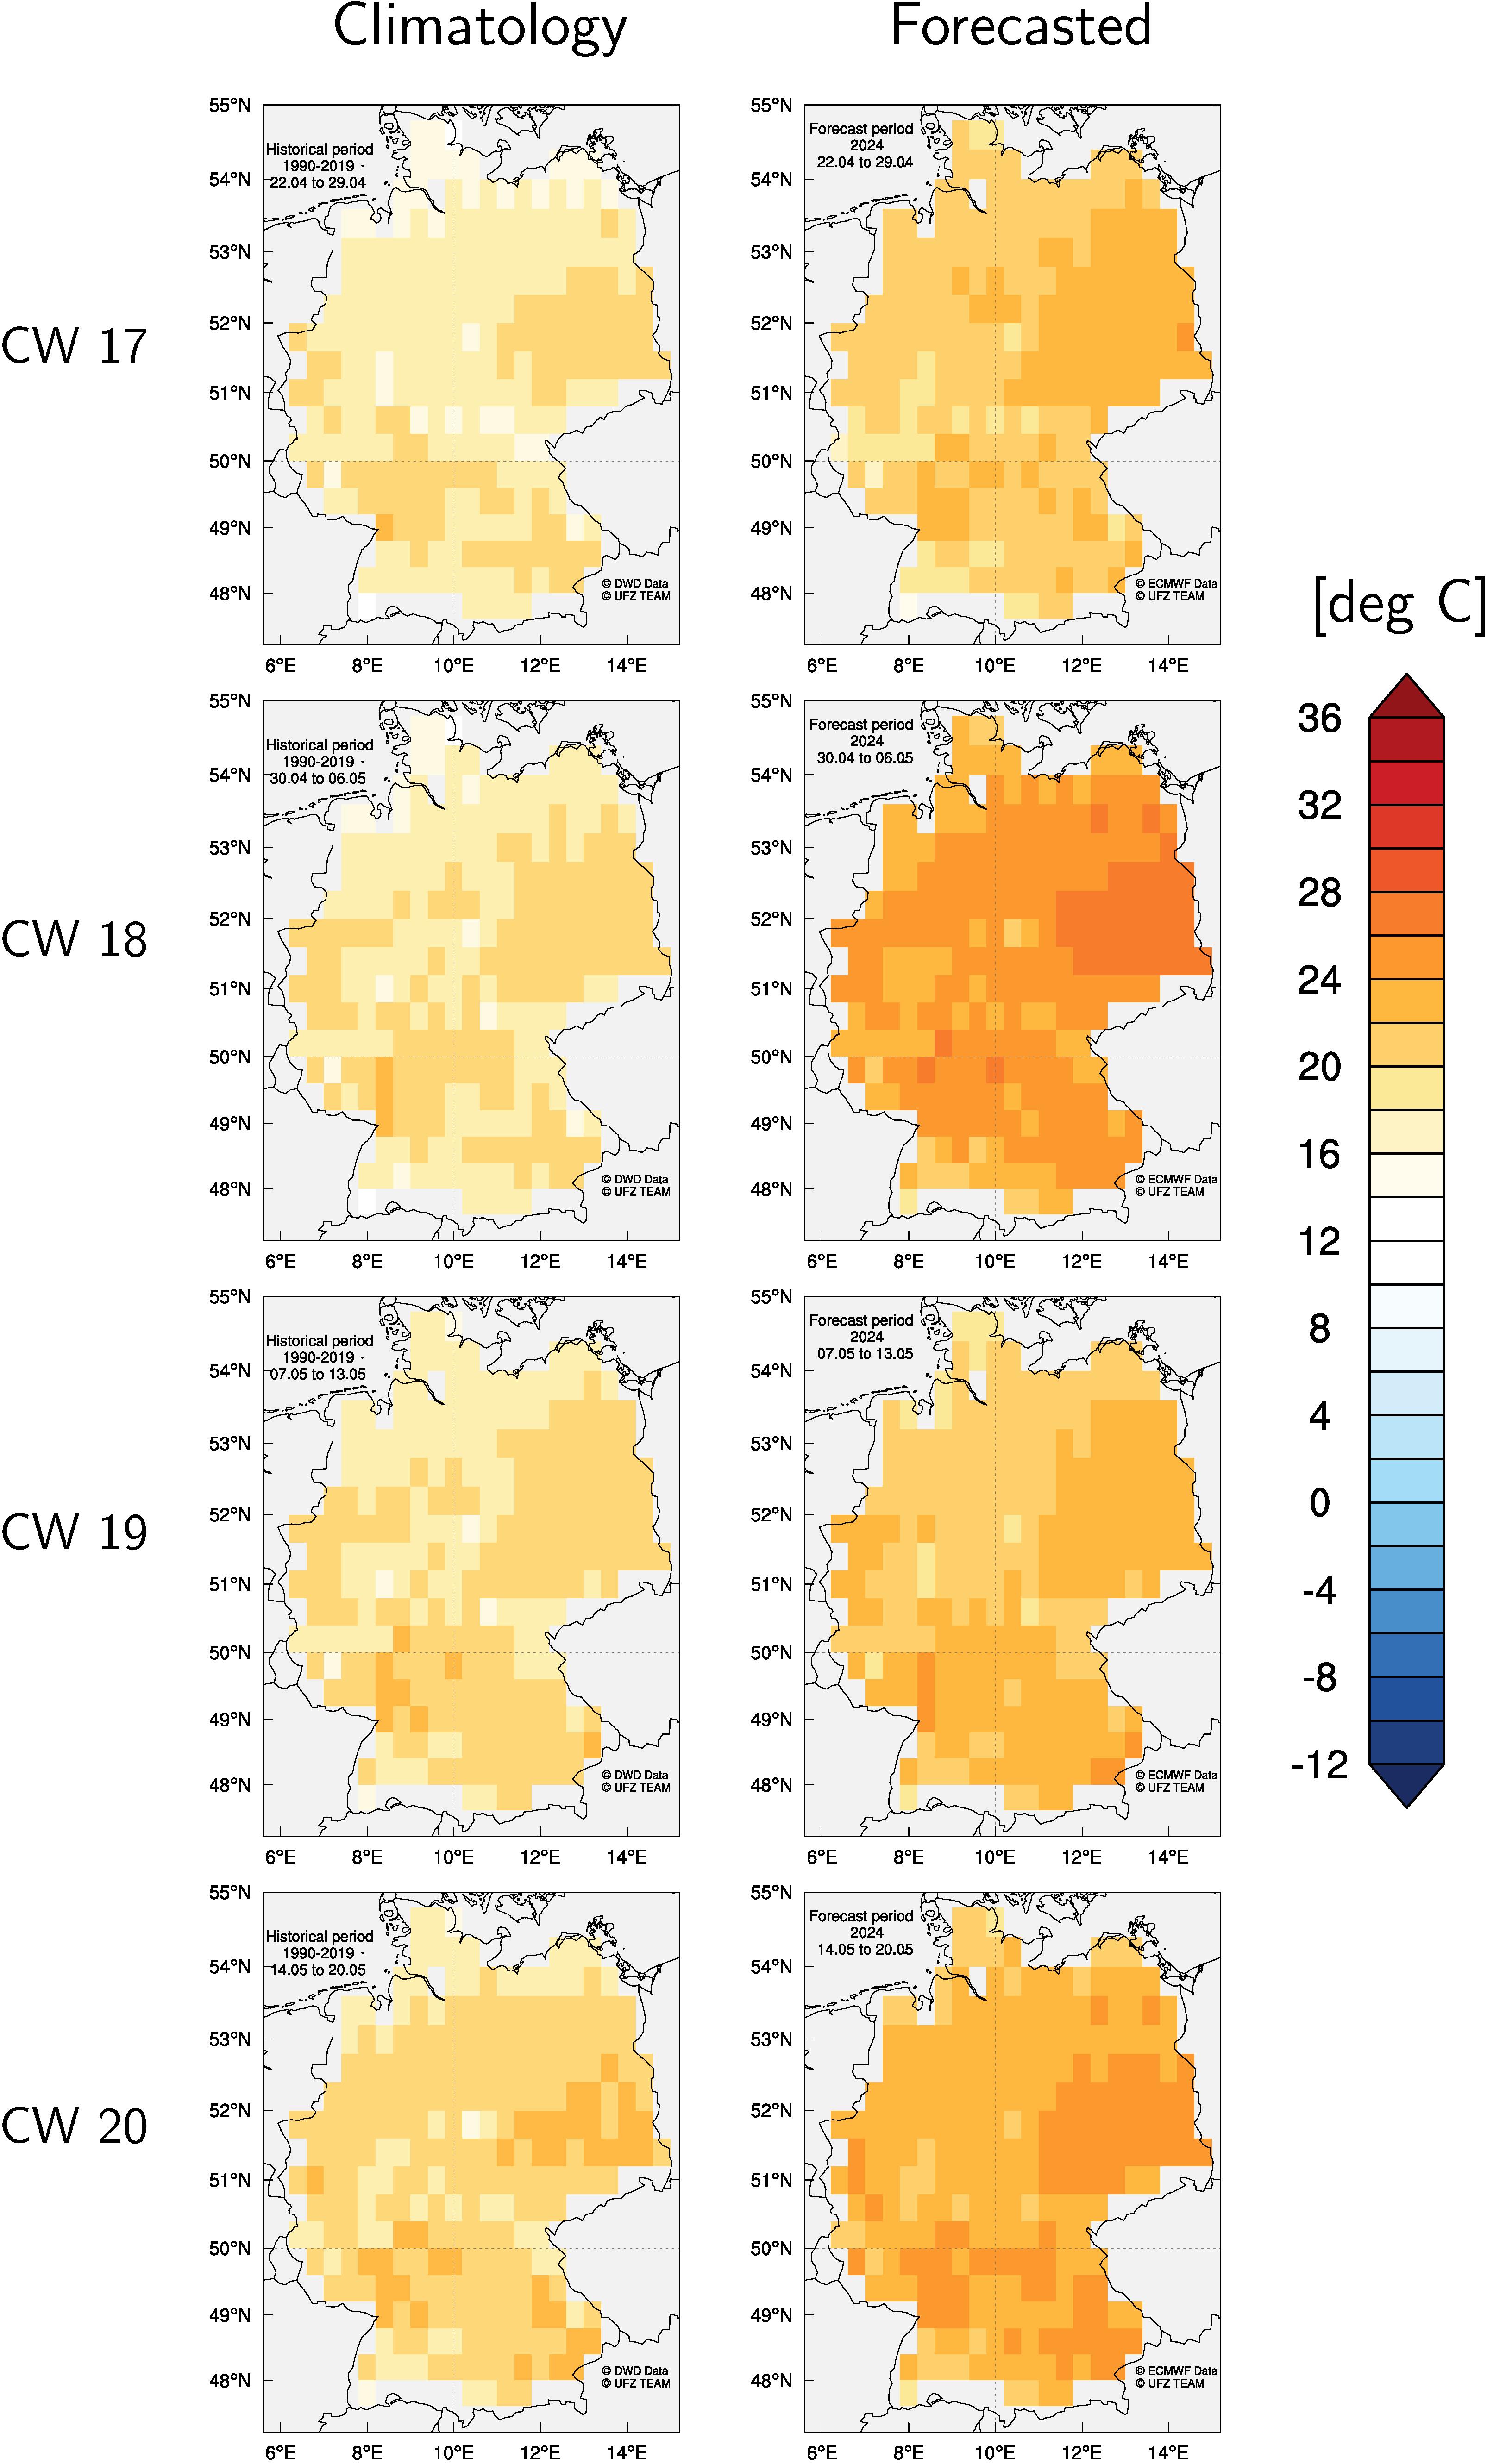
This figure provides climatological averages of maximum air temperature, which are the means of the maximum values of the variable computed over the 1990-2019 historical period based on DWD data. For the same calendar week, maximum air temperature forecast from ECMWF Ensemble Extended product is bias corrected and shown on the right. One can then compare climatological long-term averages with forecasts of the upcoming weeks. DWD station data are interpolated using the External Drift Kriging (EDK) developed by Samaniego et al. (2011).
Methodology
Sub-seasonal to Seasonal (S2S) Forecasts
Sub-seasonal to seasonal (S2S) forecasts aims to bridge the gap between medium-range weather forecasts (up to 10 days) and seasonal climate predictions (above a month). Compared to medium-range, sub-seasonal predictions (sometimes referred as extended) are issued on a daily basis, or once/twice per week but with increased lead times up to about 45 days. A real-time S2S forecasting system could provide tailored information for early warning of high impact extreme events. For HS2S application, 6-hourly real-time and re-forecast products from European Centre for Medium-Range Weather Forecasts (ECMWF) are retrieved. For more information, see ECMWF Ensemble Extended forecasts.
Forecast Terminology
- Forecast start date: The day on which a forecast is issued (e.g. July 6, 2020, Monday).
- Forecast (target) period: Time period analyzed in a forecast. In other words, the aggregated period for which a forecast is valid. It will be provided in weekly basis based on calendar weeks in this web-page.
- Forecast lead time: The time period between the forecast start date and the beginning of the forecast target period. For example, the forecasts issued on Monday has 0-week lead-time for the same calendar week (target period).
- Initial condition uncertainty: The output of numerical weather predictions are uncertain. On source of the uncertainty is the initial conditions of the atmosphere. By accepting this uncertainty, centers issuing weather and climate forecasts produce probabilistic forecasts based on Ensemble Prediction System (ENS). Different realisations are generated by perturbation of an unperturbed (control) forecast.
Pre-processing Data
Data generated from Earth-system models usually requires pre-processing. All information need to be converted into file formats which are conventional for the description of Earth sciences data. Big data consists of many records from in-situ observation and numerical weather prediction are processed in this stage to be compatible with other software tools in modeling chain. This step includes quality control of data and temporal aggregation of the original atmospheric model outputs (6 hourly) to the target period in which the forecast is disseminated or to the resolution required for next modeling chain.
Bias Correction
The raw outputs of Numerical Weather Prediction systems have model biases raised from the many sources of systematic errors. A comparison of ECMWF real-time ensemble forecasts and DWD grided data between April 2020 to March 2021 has been done for precipitation. Mean bias ranges between -1 and 1 mm/day for all forecast lead-times. Systematic error needs to be removed from atmospheric model outputs to avoid propagation to model chain (e.g. hydrological modeling).
 This figure illustrates ECMWF ensemble extended deterministic skill (mean bias) for all real-time forecasts initialized between April 1, 2020 and March 31, 2021 (114 start day in total). All forecasts issued in each month are averaged first, then the spatial average is calculated for all grid cells located in Germany in native model resolution (0.2 degree for 0 and 1-week lead times and 0.4 degree for 2 and 3-week lead times). DWD data are interpolated based on near real-time in-situ observations using External Kriging Drift (EDK) to generate grided observation fields.
To remove the bias from atmospheric forecast ensembles, a trend-preserving approach will be applied before hydrological simulation. It follows a modified version of the method propsed by Lange (2019) for S2S time scale. More information on the method can be found in Ulysses project.
mHM
Hydrological ensemble forecasts are generated based on mesoscale hydrologic model (mHM). Basin-wise calibrations over Germany from (HI-CAM project) is used for model set-up. To generate the initial conditions of the hydrological forecast, mHM is forced with near real-time meteorological in-situ data from 1500+ stations provided by the German Weather Service (DWD). HS2S takes advantage of Multiscale Parameter Regionalization (MPR) to provide high resolution drought predictions.
Soil Moisture Index
The method proposed in Samaniego et al. (2013) and Samaniego et al. (2018) is implemented to generate SMI forecasts for the next 4-week lead-time. It uses a kernel density estimator with a gaussian kernel for transforming soil moisture values to the soil moisture index (SMI). For more information, please visit SMI web-page. The figures provided in this web-page are currently based on ensemble mean from 51 real-time soil moisture forecast ensembles.
Methodology
We run a 2-week real-time SMI forecast on a regular basis using mHM driven by the latest ECMWF sub-seasonal (S2S) forecasts. Each forecast includes 51 ensemble members, so the maps communicate both the expected conditions and the associated uncertainty.
Each forecast cycle is initialized by generating hydrologic initial conditions with mHM, forced by the latest DWD station observations. The station data are interpolated to a gridded product using External Drift Kriging (EDK), conceptually similar to the interpolation approach used for the German Drought Monitor.
ECMWF meteorological forecasts are bias-corrected using a 2006–2025 reforecast reference period. The workflow produces 1-km bias-corrected atmospheric forcing fields and 1-km SMI outputs (here shown for the total soil column) together with ensemble-based uncertainty estimates. Soil moisture is simulated for the full soil column, and the SMI is computed relative to historical conditions using a 7-day aggregation window.
UFZ Developer Team and Collaborators
The HS2S is under development by joint efforts of a team consisting of postdoctoral and senior researchers at CHS department of the UFZ.
Service Manager: Husain Najafi
Contact Person and Coordinator: Luis Samaniego
Hydroclimate Forecast Team: Husain Najafi, Pallav Kumar Shrestha, Stephan Thober and Luis Samaniego
Program and Software Support: Matthias Kelbling, Friedrich Boeing
Outreach: Andreas Marx
Terms of Use, Copyright Disclaimer and License Agreement
- All forecast maps disseminated by the UFZ team on this webpage are based on research experiments.
- The material on this website does not constitute legal or other professional advice.
- Observation records of precipitation, and air temperature which are the database for calculating climatology or bias correction of atmospheric forecasts are averaged over individual values of freely available data by the Deutscher Wetterdienst (DWD).
- Copyright: “This service is based on data and products of the European Centre for Medium-Range Weather Forecasts (ECMWF).”
Source: www.ecmwf.int
Licence statement: ECMWF data are published under a Creative Commons Attribution 4.0 International (CC BY 4.0). https://creativecommons.org/licenses/by/4.0/
Disclaimer: ECMWF does not accept any liability whatsoever for any error or omission in the data, their availability, or for any loss or damage arising from their use. - Research outputs (forecast maps) are openly published without any delay linked to commercial development.