Flow Cytometry Lab
Introduction
The Flow Cytometry group specializes in the characterization of single cells in microbial populations or complex microbial communities. In addition to fingerprinting the cell heterogeneity of pure populations, dynamic changes in community composition over time are routinely analyzed. These data enable an understanding of the principles of population and community ecology and the determination of growth rates of indigenous cell types. Parallel to light scatter characteristics, autofluorescent pigments and proteins can be quantified per cell. Furthermore, viability states or other cell properties extrinsically stained with fluorescent dyes can be used to determine various physiological states. Cells from almost any environment can be analyzed. Bioinformatics tools for evaluating this data are available. It is possible to use fluorescence-activated cell sorting (FACS) to separate cell subgroups of different physiological states or specific cell types from communities to enable further downstream analyses such as sequencing (16S rRNA gene sequencing or whole genome sequencing) or for proteomic analyses. The cells can also be counted and sorted into well plates in defined quantities (between 1 and 1000) for follow-up cultivation approaches or on microscopic slides for visualization.
Principle of Flow Cytometry
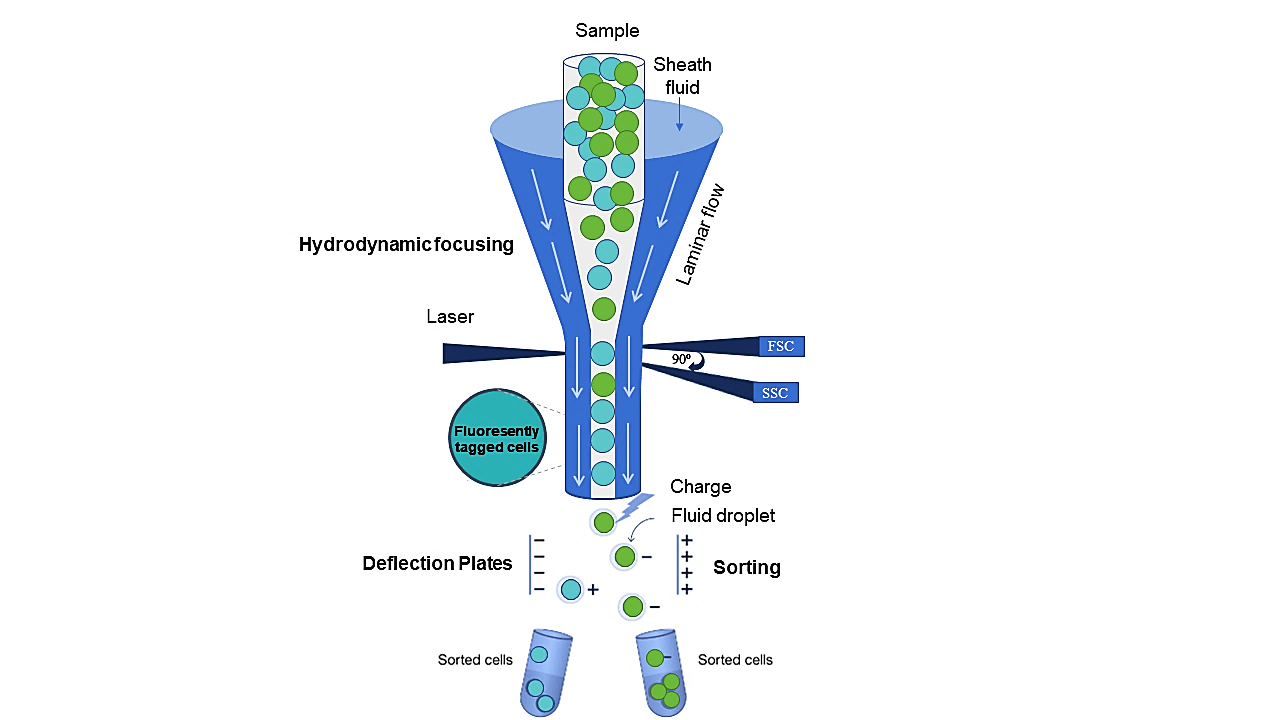
Flow cytometry is a UV and visible light based microscopic technology that provides a multi-parametric analysis of cells as they pass the objective as single events in a fluid stream. The hydrodynamic focusing ensures that cells are precisely aligned and provided as single cells for an accurate analysis. As the cells pass through the detection region, they are hit with photons emitted by one or multiple lasers. The cells release or scatter photons which are then detected by photomultiplier tubes (PMTs) that generate an amplified electrical current which is related to the fluorescence intensities or scatter characteristics of the cells. Photons that are scattered forwards at an angle of less than 20⁰ generate the forward scatter signal; this parameter corresponds to the cell size. Orthogonally scattered photons that are captured at an angle of 90⁰ generate the side scatter signal; this parameter corresponds to the cell granularity. In addition, fluorescent light signals can be captured using flow cytometry, also at a 90° angle and passed through a series of filters to specifically measure fluorescence emission. This provides various cell-bound information that can be used to distinguish between different cell types in populations or communities belonging to a sample.Cell sorting (FACS) is used for the precise isolation of individual cells. In this method, droplets carrying the target cells are formed downstream of the detection zone and then either positively or negatively charged and separated from each other by deflector plates. Each specific characteristic, such as fluorescence intensity or cell size, can be used for a sorting decision. Vital cells can be sorted on agar plates, in wells or tubes with suitable growth media. It is also possible to sort cells for further downstream analyses, e.g. for metagenome sequencing of specific cell subsets.
State-of-the-art Equipment
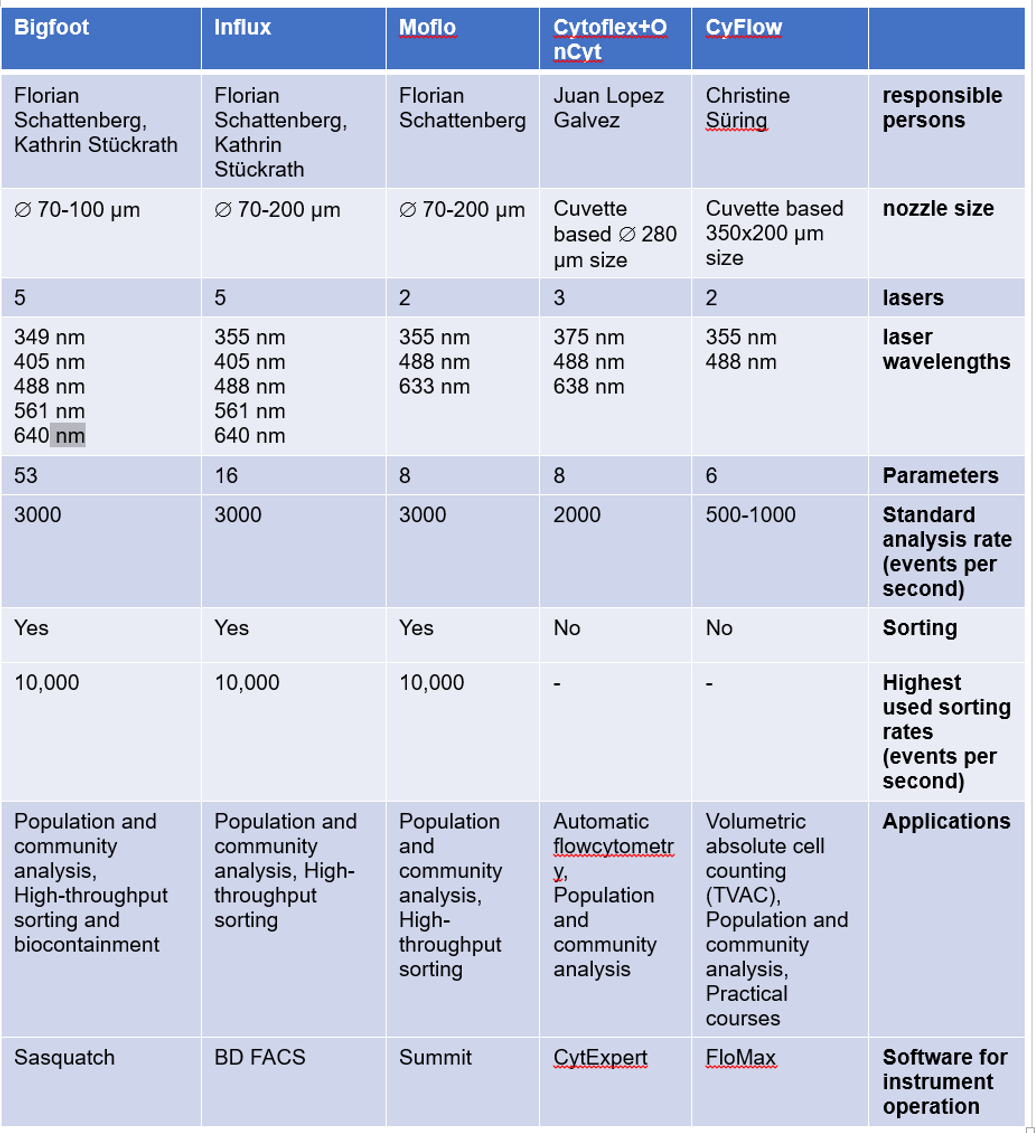
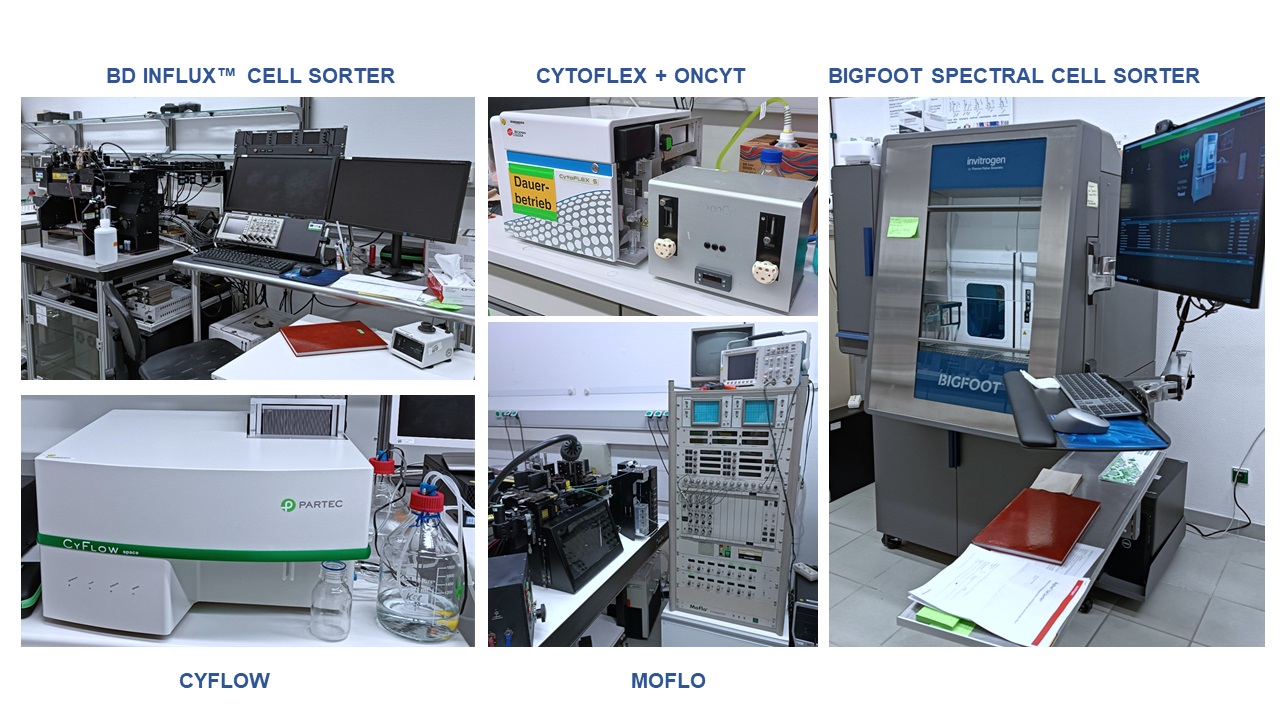
Five flow cytometers are designated for different research activities. Three of them are used for sorting purposes and two of them are used as benchtop devices. A comparative overview of our current devices is given in Table 1.
1. Bigfoot
With up to 5 lasers and 53 detectors, the spectral unmixing capabilities of the Bigfoot device discriminates cell types in populations and communities at a high level and can detect autofluorescence and corresponding changes in a more defined and more sensitive way compared to the other devices. The biosafety level 2 containment with integrated HEPA filter and aerosol management provides integrated biocontainment and personal protection. This makes the high-performance and high-throughput measurements for down-stream OMIC applications more convenient and faster. The Bigfoot Spectral Cell Sorter utilizes multiway sorting into 1.5 mL to 50mL tubes, into 24 to 384-well plates, and also on 1536-well sorting plates (Thermo Fisher Scientific. Bigfoot spectral cell sorter: https://www.thermofisher.com/de/de/home/life-science/cell-analysis/flow-cytometry/flow-cytometers/bigfoot-spectral-cell-sorter.html).
2. Influx
The BD Influx™ cell sorter contains 5 excitation lasers which could record several cell parameters at the same time. The detection of low fluorescence intensities makes it possible to characterize bacteria particularly well and to resolve microbial populations and communities at a high level. It uses BD FACS™ Accudrop technology to determine a precise drop delay for sorting directly onto culture plates, 24 to 96 well plates and 1.5 – 50 mL tubes. Multiple 4-way and 6-way sortings are possible (https://www.bd.com/resource.aspx?IDX=17866).
3. MoFlo
The MoFlo Legacy cell sorter is equipped with three lasers. It is used for both subpopulation and community analysis. The Moflo is an old equipment which would be dismantled soon.
4. CyFlow
Compared to other cytometers, the CyFlow Space is relatively easy to use and has a resolution of 0.5 to 100 µm for particle measurement. It analyzes the absolute cell and particle number per mL by True Volumetric Absolute Counting (TVAC). It is used for routine analyses of environmental samples such as waste water and for the training of students in practical courses and university internships (https://www.sysmex.de/produkte/details/cyflow-space.html).
5. CytoFLEX
CytoFLEX (Beckman Coulter, Brea, CA, USA) contains 3 lasers and is coupled with OC-300 automation device (onCyt Microbiology, Zürich, Switzerland) for automated flow cytometry operations such as sampling, fixation and staining. The device is on loan from OnCyte and will only be available until mid-2025. It measures the cell density or fingerprint-like patterns of bacterial populations or communities and thus generates suitable data for powerful automatic data analysis and interpretation pipelines. This makes the data available in a very short time and enables online monitoring of bioreactors.
Methods
Samples
The flow cytometry group specializes in the analysis of prokaryotic (bacteria, cyanobacteria and archaea) and eukaryotic (yeast and algae) cells. Microorganisms can be analyzed in all life stages, such as vegetative/dead cells, spores, biofilms, etc. Suspensions with single cells are necessary. For all samples, additional filtration is performed with Celltrics filters with a pore size of 50 µm to prevent clogging of the 70 µm nozzle.
Live versus fixed cells
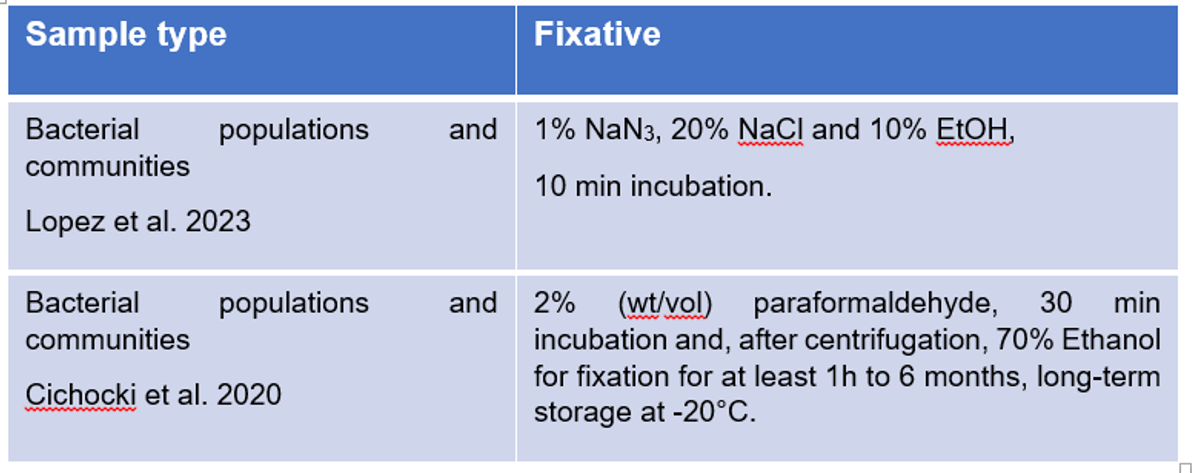
Flow cytometry could be done for live (real-time) or fixed cells. Fixation with chemicals such as paraformaldehyde (PFA) intensely crosslinks surface proteins of cells which stabilize and close their membranes. After 30 min the PFA is removed and the cells are suspended in 70 % ethanol and stored at -20°C. This methods allows us to store samples over long periods of time up to 6 months. Moreover, there are no biosafety concerns with the fixed samples. Similar staining protocols can be used for both live and fixed cells to label specific cellular components or biomarkers. Live cells are metabolically active and retain their physiological functions, while fixed cells have halted metabolic activity and preserved cell structure.
To fix cells, two fixation protocols are available.
Staining
1. Fluorescent proteins
The fluorescently labeled reporter proteins can be easily measured. Some of the widely used fluorescent proteins include:
A. Green Fluorescent Protein (GFP): GFP is one of the most common fluorescent proteins used as a marker for gene expression in molecular and cell biology. The excitation and emission wavelength for GFP are 470 to 490 nm and 510 to 530 nm, respectively.
B. Red Fluorescent Protein (RFP): RFPs, such as DsRed and mCherry, emit red light and are often used alongside GFP for dual labeling experiments. RFPs typically have an excitation wavelength in the range of 550 to 590 nm and an emission wavelength around 590 to 650 nm.
C. Yellow Fluorescent Protein (YFP): YFP, like Citrine (derived from Aequorea victoria), emits yellow light and is frequently used in combination with other fluorescent proteins. YFP has an excitation wavelength typically ranging from 505 to 515 nm and an emission wavelength typically ranging from 520 to 570 nm.
D. Cyan Fluorescent Protein (CFP): CFPs, such as Cerulean (derived from Aequorea victoria), emit cyan light and are employed in multicolor imaging experiments. CFP has an excitation wavelength of approximately 433 nm and an emission wavelength of around 475 nm.
E. Blue Fluorescent Protein (BFP): BFPs emit blue light and can be used in combination with other fluorescent proteins for multicolor imaging. BFPs have an excitation wavelength ranging from approximately 380 to 410 nm and an emission wavelength around 440 to 470 nm.
2. Autofluorescence
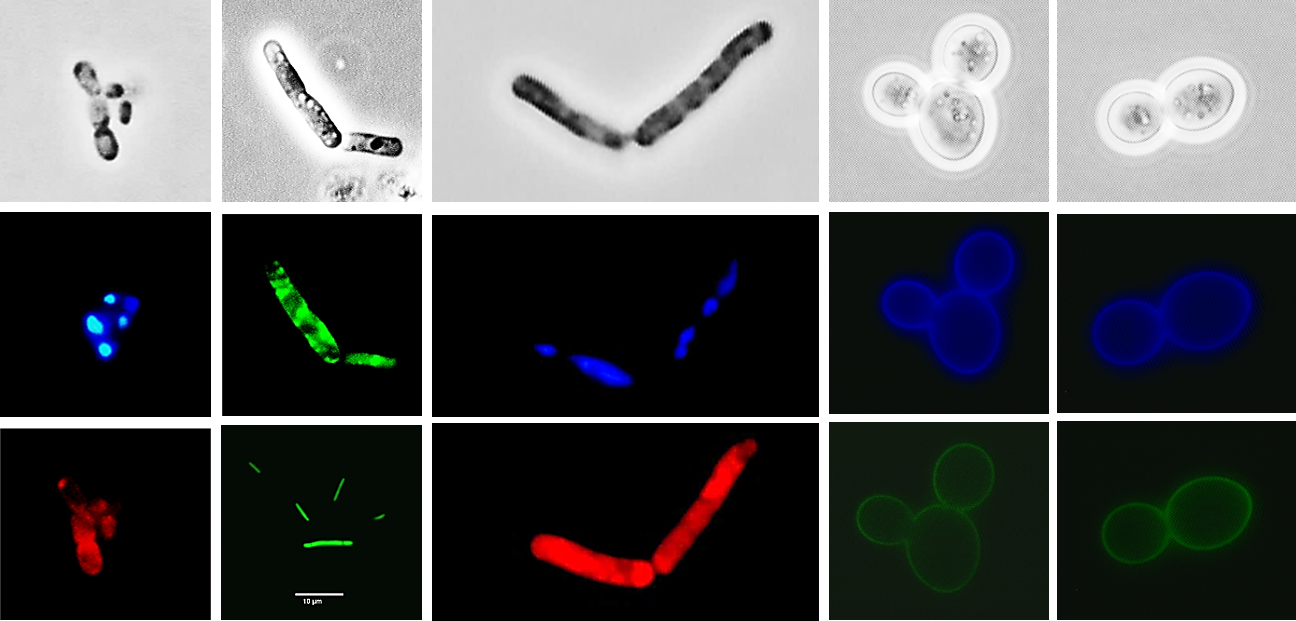
Some bacteria, cyanobacteria, algae, and archaea contain endogenous fluorophores, which emit autofluorescence when excited by UV/Visual radiation of a suitable wavelength. Various cellular components can contribute to autofluorescence, including pigments. Autofluorescence-based identification allows for label-free detection, without the need for exogenous fluorescent labels or probes.
3. Fluorescent dyes
Cells can be stained through a variety of fluorescent reagents for flow cytometry analysis. These include DNA binding dyes, viability dyes, and ion indicator dyes.
In the flow cytometry group the following fluorescent dyes for population and community analysis are used:
1. DAPI (4',6-diamidino-2-phenylindole): DAPI is a DNA-specific fluorescent dye that can be used to stain bacterial DNA. It is commonly used to assess cell cycle progression and community fingerprinting.
2. SYTO 9: SYTO dyes are nucleic acid stains that can penetrate intact bacterial cells. They are often used for total cell counting and viability assessments. SYTO 9 is a green-fluorescent dye that stains both live and dead cells.
3. Propidium Iodide (PI): PI is a DNA-binding dye that can be used to differentiate between live and possibly dead cells based on their membrane integrity. Live cells exclude PI, while cells with compromised membranes allow PI to enter.
4. SYBR Green: SYBR Green is a nucleic acid binding dye that emits fluorescence upon binding to double-stranded nucleic acids. SYBR Green binds to both DNA and RNA.
5. Hoechst 33342: Hoechst 33342 is a cell-permeant DNA dye that binds preferentially to adenine-thymine (AT)-rich regions of DNA. It is used to quantify DNA content and identify different phases of the cell cycle.
6. FDA (fluorescein diacetate) is a non-fluorescent cell-permeant dye that is converted into a green fluorescent product, fluorescein, via intracellular esterases in live cells. The dead cells show no esterase activity and therefore the dye is used to assess the cell viability.
7. 3,3'-dihexyloxacarbocyanine iodide (diOC6(3)) is a lipophilic cationic dye that shows changes in bacterial membrane potential and can provide insights into bacterial viability, membrane potential activity, and responses to various environmental conditions.
8. Nile Red is a lipophilic dye that is widely used for staining and visualizing neutral lipids, particularly triglycerides and lipoproteins, in cells.
9. Lectins or antibodies conjugated with fluorescent dyes can be used for identifying specific cell populations based on carbohydrate-mediated interactions or attaching to specific cell surface regions.
Alignment of flow cytometers
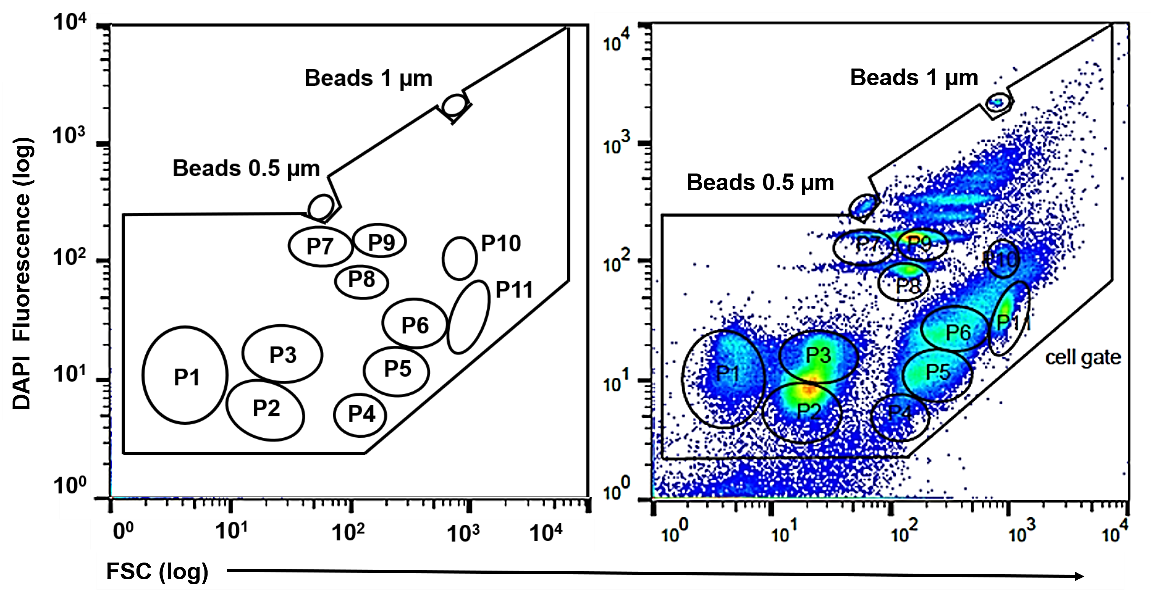
In flow cytometry, noise may arise from imprecise alignment of the optics and fluctuations in laser stability over time. To avoid this, lasers are carefully aligned to ensure that their beams are properly focused onto the sample stream for the detection of fluorescence emission. Standardized monodisperse beads are routinely utilized in the flow cytometers. Typically, mono- or multi-fluorescent beads ranging in size from 0.5 to 1 μm are used for this purpose. These calibration beads are fluorescent microspheres with known fluorescence properties, including fluorescence intensity and emission spectra. By running calibration beads through the flow cytometer, operators can adjust PMT voltages and gain settings to standardize and optimize signal-to-noise ratios. Proper alignment using calibration beads enhances the reliability and reproducibility of flow cytometry data, enabling accurate quantification and analysis of samples.
Mock Community
While alignment beads help minimize instrumental noise and harmonize overall machine settings, the use of an artificial microbial cytometric mock community (mCMC) is indispensable for validating lab workflows, staining procedures and data comparison across experiments. The mCMC acts as a vital reference standard for consistently characterizing microbial communities via cytometric analysis, especially in longitudinal studies. Comprising three pure strains (Stenotrophomonas rhizophila DSM 14405, Kocuria rhizophila DSM 348, and Paenibacillus polymyxa DSM 36), the mCMC exhibits cell populations distributed throughout the 2D plot, covering both lower and upper logarithmic scale ranges, allowing for their separation by gates. Moreover, the mCMC addresses heterogeneity arising from subpopulations, adding complexity to the analysis. Its utility extends to adjusting bacteria position and resolution range in all commercial flow cytometers, enhancing instrument resolution and reducing background noise, identifying and mitigating operator-dependent errors or variations in cell treatment, and maintaining consistent cell positions during long-term experiments to ensure the stability of cytometric community patterns, thereby facilitating automated bioinformatics evaluation pipelines.
Bioinformatics analysis tools
In order to probe, monitor, and eventually control artificial or natural communities in managed systems, rapid detection and evaluation methods are required. Cytometric fingerprints of complex microbial communities and pure culture subpopulations can be evaluated through the biTCa Analyze Tool graphical user interface (GUI). It contains all the bioinformatic tools developed by our lab such as Cytometric Histogram Image Comparison (flowCHIC), Cytometric Barcoding (flowCyBar) and flowEMMi.
1. Cytometric Histogram Image Comparison (flowCHIC)
All cytometric 2D plots are converted to gray scale images, and these images are then compared based on the average grey value per informative pixel. The differences in cell abundance are represented by the NMDS plots. The R-package flowCHIC and its instruction manual can be downloaded from Bioconductor platform as
Schumann J, Koch C, Fetzer I, Müller S (2019). flowCHIC - Analyze flow cytometric data of complex microbial communities based on histogram images. R package version 1.36.0, https://bioconductor.org/packages/flowCHIC.
https://www.frontiersin.org/journals/microbiology/articles/10.3389/fmicb.2014.00273/full
https://www.ncbi.nlm.nih.gov/pmc/articles/PMC6126456/
https://onlinelibrary.wiley.com/doi/full/10.1002/cyto.a.22286
2. Cytometric Barcoding (CyBar)
CyBar illustrates the changes in cell abundances of subcommunities in correlation to the temporal, spatial, abiotic, and biotic parameters through NMDS, boxplots, and heat maps (correlation, interactions potential). The R-package flowCyBar and its instruction manual can be downloaded from the Bioconductor platform as
Schumann J, Koch C, Günther S, Fetzer I, Müller S (2015). flowCyBar - Analyze flow cytometric data using gate information. R package version 1.38.0, https://bioconductor.org/packages/flowCyBar.
https://pubs.acs.org/doi/full/10.1021/es3041048
https://www.pnas.org/doi/10.1073/pnas.2117814119
https://www.nature.com/articles/nprot.2012.149
3. flowEMMi
flowEMMi v2 is an automatic model-based clustering tool for cytometric community data based on multivariate Gaussian mixture models which marks all subcommunities in the histograms with different gates and then a combined gate template is finally applied to all samples. This tool provides fast and accurate cell clustering for dynamic community analyses bypassing technical noise or beads.
flowEMMi v2: Software could be downloaded and installed from https://github.com/choener/flowEMMi
https://www.sciencedirect.com/science/article/pii/S200103702200527X
https://www.mdpi.com/2073-4409/12/12/1559
Applications
1. Microbial community ecology
Maintaining the desired microbial community in bioreactors and determining the structures of communities in natural biospheres are important applications of microbial flow cytometry. Microbial communities can be highly diverse, are susceptible to stochastic fluctuations and loss of key players is common. Our flow cytometric analysis in combination with bioinformatics and ecological tools reveals the dynamics and fate of community structures much faster than sequencing technologies. We use various diversity indices and interaction profiles to describe community assembly strategies and the functional dependencies of community members. We offer this expertise to understand the ecological paradigm that forms the communities of interest in their respective environments.
Questions to be addressed:
1. Analyze microbial intracommunity structure variation and identifying subcommunity function.
2. Enable quantification of single cell dynamics and on-line evaluation of community attributes.
3. Compute the stability properties resistance, resilience, displacement speed, and elasticity of the bioreactor community.
4. Interpret the community paradigms, trends and development.
5. Reveal possible stimuli and constraints that influence community structure and function.
6. Maintain stable community in your bioreactor, avoiding washout.
How to do it:
Cells have to be fixed. The cell density must be adjusted, DAPI staining performed and fingerprinting carried out. The resulting subcommunities must be gated and the frequency of cells per gate must be determined. Any assessment tool can then be used.
Requirements for the sample:
The sample must be a cell suspension without impurities. The cells may be sonicated, vortexed, washed and filtered to remove aggregates and particles.
Technologies developed:
A. Looped mass transfer technology
Our recently developed looped mass transfer technology makes sure that the microbial communities are kept stable and retained in the bioreactors. If you are dealing with the microbial community loss in your bioprocess, then this may be alternative solution. Contact us.
B. Stability and diversity measures
Ecological stability properties of microbial communities can be assessed by flow cytometry.
C. Net growth rate
Determination of growth of subpopulation within communities can be assessed by flow cytometry.
https://www.pnas.org/doi/full/10.1073/pnas.2117814119
https://enviromicro-journals.onlinelibrary.wiley.com/doi/10.1111/1462-2920.13402
https://experiments.springernature.com/articles/10.1038/nprot.2012.149
https://pubmed.ncbi.nlm.nih.gov/30289191/
https://onlinelibrary.wiley.com/doi/10.1002/cyto.a.23965
https://www.ncbi.nlm.nih.gov/pmc/articles/PMC5770544/
https://onlinelibrary.wiley.com/doi/10.1002/eji.201646297
https://microbiomejournal.biomedcentral.com/articles/10.1186/s40168-020-0788-1
https://microbialcellfactories.biomedcentral.com/articles/10.1186/s12934-019-1143-8
2. Differential staining and subpopulation analysis
Bioconversion could be improved by analyzing different subpopulations and their contributions. This enables process optimization by changing operational parameters. For the differentiated staining of cells from pure or co-cultures, a range of fluorescent dyes are available for
1. Biomolecules synthesis
2. Metabolically active states
3. Cell cycle studies
4. Subpopulation analysis
Questions to be addressed:
1. Study different physiological or expressional subpopulations of organism of interest.
2. Cell cycle characteristics of organism depending on different substrates or constraints.
3. Viability and counts of live/dead cells.
4. Polymer formation such as Polyhydroxyalkanoates (PHA).
5. Fluorescent labeled genes expression in subpopulations.
How to do it:
Cells could be measured live or fixated (with the established fixation protocols). After optical density adjustment, staining, and filtration the cells are cytometrically analysed.
Requirements for the sample:
The sample must be a cell suspension without impurities which may be sonicated, vortexed, washed and filtered to remove aggregates and particles. https://onlinelibrary.wiley.com/doi/epdf/10.1111/j.1365-2184.2007.00465.x
https://onlinelibrary.wiley.com/doi/pdf/10.1002/cyto.a.20402
https://enviromicro-journals.onlinelibrary.wiley.com/doi/10.1111/1751-7915.12018
https://www.sciencedirect.com/science/article/pii/S0958166912001723
https://pubs.acs.org/doi/10.1021/ac501118v
3. Sorting for OMICS applications
The working group Flow Cytometry has three sorters. Single cells can be differentiated from each other based on their fluorescence characteristics and sorted. Selected cells are utilized for an array of downstream experiments, including functional assays, DNA analysis, gene/protein expression analysis, pure cultures, colony characterization, and strains development.
Questions to be addressed:
1. Separate any fluorescence emitting reporter cells expressing the protein of interest from background cells.
2. Sorting of differentially stained cells from each other and non-stained cells.
3. Sorting of different physiological states of cells during replication for recultivation.
4. Separate and sort low abundant cells from high abundant ones for 16S rRNA sequencing or whole genome sequencing or other OMICS applications.
5. Sort the different cells and spores based on size and densities.
6. Sort Archaea/Cyanobacteria from bacteria based on their autofluorescence.
7. Sort alive cells from dead cells.
How to do it:
Identifying the region of interest to sort through gating. Please contact the responsible person to run some initial test runs.
Requirements for the sample:
The sample must be a cell suspension with cell densities not less than 105. The cells may be sonicated, vortexed, washed and filtered to remove aggregates and impurities. The volume depends on the downstream applications.
https://www.mdpi.com/2076-2607/11/1/175
https://microbialcellfactories.biomedcentral.com/articles/10.1186/s12934-016-0610-8
https://microbialcellfactories.biomedcentral.com/articles/10.1186/s12934-017-0793-7
