Workflows
In the department Environmental Informatics, we employ OpenGeoSys, an open-source platform and flexible numerical framework for the simulation of thermo-hydro-mechanical/chemical (THM/C) processes in porous and fractured media with applications in geoscience and hydrology. In order to simulate these processes, models are defined that include as much relevant data as possible to account for all phenomena defining a particular natural system. Heterogeneous data sets representing the model characteristics are given as input parameters to the simulation software which returns result data sets predicting system behavior in areas of interest. All OpenGeoSys file formats containing spacial data can be converted to ParaView's VTK file formats for visualisation purposes.
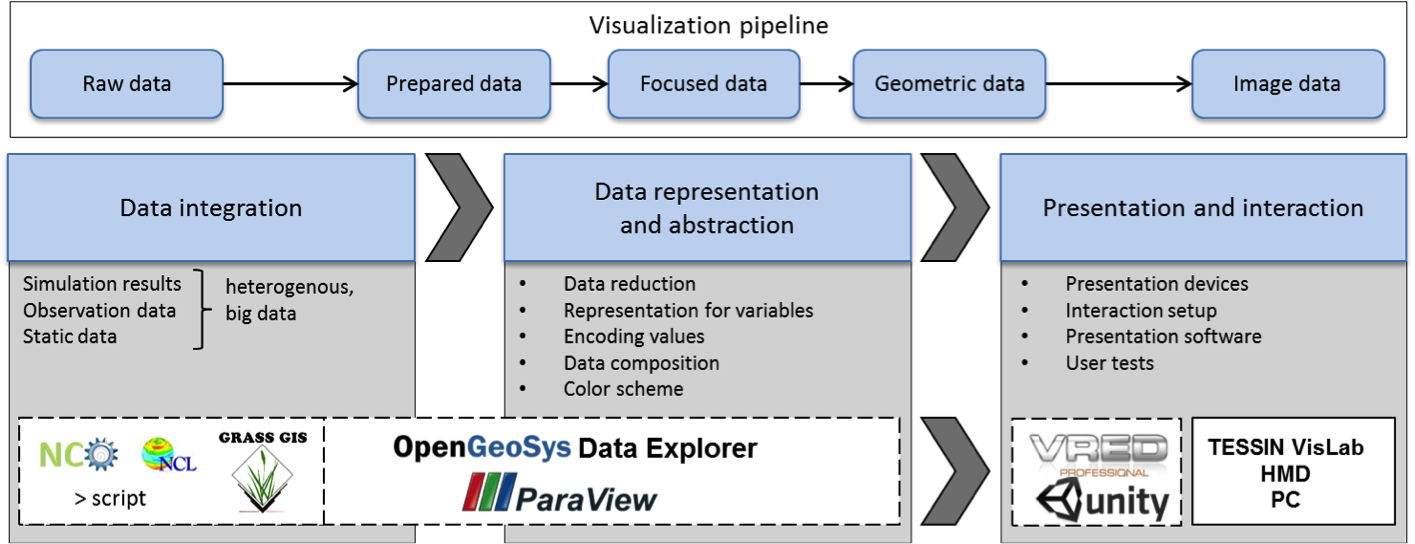
Data from other modelling- and simulation-frameworks using different formats can be easily integrated into an existing visualisation project if there is a conversion possible into one of ParaViews supported formats or a custom ParaView reader plugin can be developed. Data integration as the first step in our workflow. It deals with gathering raw data and combining them into a unified data space (common coordinate system and mapping as well as a common temporal scale).
Visualisation is about data representation and abstraction. A good representation of a specific data set is necessary to intuitively explore and analyse it and in the end to gain new knowledge. Data reduction techniques help in handling large and heterogeneous data sets. As a basis for creating visualisations, we employ the VTK software library, which is also integrated into the OGS Data Explorer framework (a data integration and visualisation framework for pre- and post-processing OpenGeoSys simulation data) as well as ParaView.
Presentation and interaction as the last step in our workflow employs our special display hardware. Interaction in a VR environment differs from ordinary human-computer interfaces and is best done with tracked devices (Flystick) which allow for a natural interaction by virtually picking objects. Wireless devices such as GamePads can also be used. Interactions are implemented in a custom Unity framework. Multiple data sets can be arranged both in a spatial but also in a temporal context and a variety of presentation techniques are implemented. Examples include the definition of camera animations, fading in/out of data sets, selection of data subsets, displaying additional information attached to data sets, and many more. We provide utilities and ParaView plug-ins to convert VTK visualisation data to formats supported by Unity (i.e. Autodesk FBX). Conversion can be done either manually or in a batch process by employing ParaView’s Python scripting interface. The second approach is especially useful when converting large sequences of complex data sets such as time steps of simulation results from transient finite element models. During conversion, meta-data is appended to the data sets to include information not necessarily supported in FBX such as a specific material and rendering setup or time stepping information. This metadata is evaluated when loading the data sets into Unity and can be queried, e.g. for displaying the time stepping information as a text overlay.
This diagram shows an example workflow specific to the MEVA-project.

