To achieve more realistic simulations, meteorologists develop and use models with increas- ing spatial and temporal resolution. The analyzing, comparing, and visualizing of resulting simulations becomes more and more challenging due to the growing amounts and multifaceted character of the data. Various data sources, numerous variables and multiple simulations lead to a complex database. Although a variety of software exists suited for the visualization of meteorological data, none of them fulfills all of the typical domain-specific requirements: support for quasi-standard data formats and different grid types, standard visualization techniques for scalar and vector data, visualization of the context (e.g., topography) and other static data, support for multiple presentation devices used in modern sciences (e.g., virtual reality), a user-friendly interface, and suitability for cooperative work.
Methods and Results
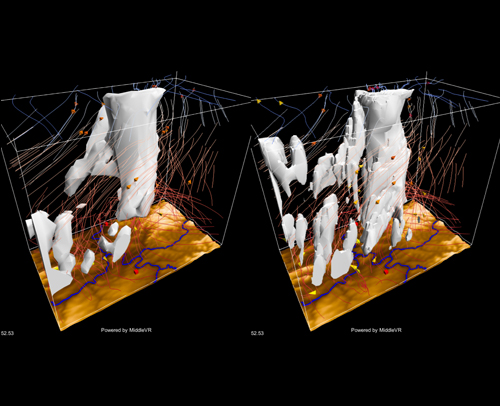
Instead of attempting to develop yet another new visualization system to fulfill all possible needs in this application domain, our approach is to provide a flexible workflow that com- bines different existing state-of-the-art visualization software components in order to hide the complexity of 3D data visualization tools from the end user. To complete the workflow and to enable the domain scientists to interactively visualize their data without advanced skills in 3D visualization systems, we developed a lightweight custom visualization application (MEVA - multifaceted environmental data visualization application) that supports the most relevant visualization and interaction techniques and can be easily deployed. Specifically, our workflow combines a variety of different data abstraction methods provided by a state-of-the-art 3D visualization application with the interaction and presentation features of a computer-games engine. Our customized application includes solutions for the analysis of multirun data, specifically with respect to data uncertainty and differences between simulation runs. In an iterative development process, our easy-to-use application was developed in close cooperation with meteorologists and visualization experts. The usability of the application has been validated with user tests. We report on how this application supports the users to prove and disprove existing hypotheses and discover new insights. In addition, the application has been used at public events to communicate research results.
We use cookies, which are necessary for the basic functionality of our website, so that it can be continuously optimised for you and its user-friendliness improved. In addition, we use the web analysis tool Matomo, which tracks data anonymously. This enables us to statistically evaluate the use of our website. Your consent to the use of Matomo can be revoked at any time via the privacy policy.