Landscape Visualization and Windpark Planning
- FlächEn Project -

The German government aims to increase by about threefold the contribution that wind power generated energy makes to overall primary energy consumption by 2020. The current regulatory practice regarding land use means that suitable locations for new wind parks are becoming scarce and this aim to increase the number of wind parks is beginning to conflict with issues related to environmental, nature, and landscape protection. The FlächEn Project, run jointly by the UFZ Centre for Environmental Research and the Technical University Berlin, should contribute to minimizing these conflicts.
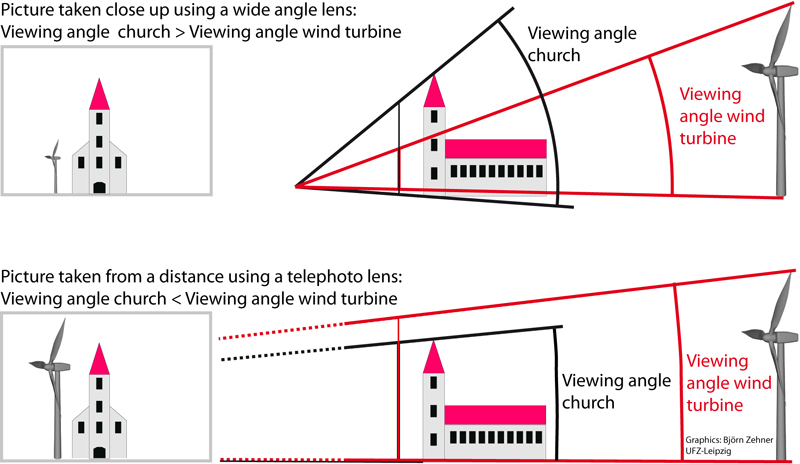
In one sub-project of FlächEn the public opinion on the different attributes (e.g. number of turbines per wind-park, permitted height of the turbines, minimum distance to the next village) has been evaluated using opinion polls with choice cards. However, simply using this kind of opinion poll might be debatable because most interviewees have no experience of imagining the visual impact that a wind turbine with a specific height has on the landscape. Using 3D visualization certainly helps here but still creates an impression that is dependent on the rendering parameters such as the focal length of the optics, and so influences the viewer’s perception of the scenery shown. This is illustrated in the figure below. In both diagrams the same configuration of a church with a wind turbine behind it is shown on the right and the corresponding picture on the left. At the top the picture is taken close up using a wide angle lens and at the bottom using a telephoto lens from a distance. It is clear that the impression is very different, even if the real world setting is the same. For technical reasons virtual reality systems do not show this effect and so offer a more objective visualization of the scene.

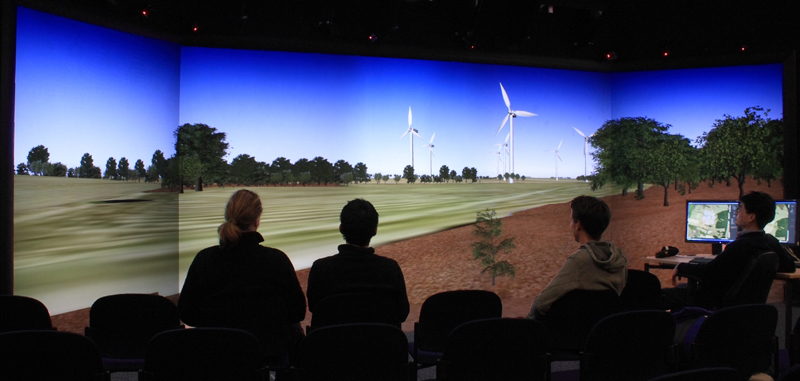
With this in mind, the idea was to provide an example scenario of how the UFZ’s visualization centre could be used in public participation and to show this both to the public and to professionals involved in the planning process. As a first step essential research has been undertaken to establish the workflow required to start with the GIS data from a certain region and generate a 3D landscape model that can be run in real time on our display. This work has recently been published in Zehner (2008).
As a second step an interactive system has been developed which provides a simple user interface for configuring a wind park that is then shown in the visualization centre. Users can choose from a predefined set of wind turbines, place them in the landscape, move them and remove them while the rated power of the wind park is shown, thus enabling them to try out different scenarios. This system has been presented at a public event and to professionals that are involved in the planning process in order to get valuable feedback regarding usability and the usefulness of the system. This second part of the work is described in a more detailed fashion in Zehner (2009/2010).
Zehner, B. (2008): Landscape Visualization in High Resolution Stereoscopic Visualization Environments, In: Buhmann, E., Pietsch, M., Heins, M. (Hg.), Digital Design in Landscape Architecture 2008, Conference Proceedings, Wichmann Verlag, Heidelberg, p. 224-231.
Zehner, B. (2010): Interactive Wind Park Planning in a Visualization Center - Giving Control to the User, In: Buhmann, E., Pietsch, M., Kretzler, E. (Eds.), Digital Design in Landscape Architecture 2010, Wichmann Verlag, VDE Verlag GmbH, Berlin and Offenbach, p. 287-294.
