Global Agricultural Production:
Trends and Stability
Currently, human population on earth is eight billion people. Although the quantities of agricultural products produced would be sufficient to feed everybody, ten percent are undernourished. If, according to the United Nations and the World Health Organisation, between 9 and 12 billion people will be living on this planet in 2060, the demand for food will increase significantly. The expected effects of climate change in the same period are expected to cause significant yield losses - among others - due higher average annual temperatures and more intense and more frequent extreme events.
In addition to the rapid reduction of crop losses and food waste as well as a much lower-energy diet (e.g. vegetarian), sufficiently high and stable yields are a major challenge for agricultural activity.
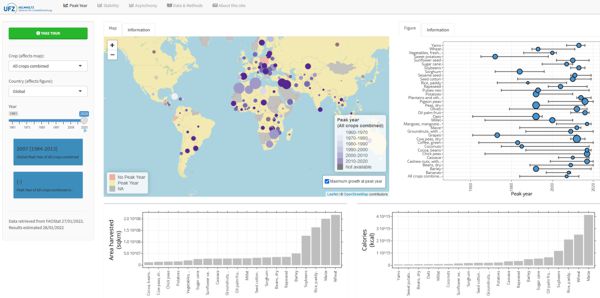
The interactive Webtool available here uses annually updated data from the World Agricultural Organisation (FAO). It provides information on the development over time of the production of the 35 globally most important crops in the 109 countries of the world, which account for 99 percent of the cultivated area of these crops. It further shows for these countries whether a maximum annual increase in production has been achieved and how stable or asynchronous production is.Since the 1960s, global food production has increased significantly. One reason for this increase in production is the expansion of land for agriculture. By now humans have taken 70 percent of the earth's terrestrial surface in use: for grasslands, arable fields, transport infrastructure or settlements. However, the available land is - obviously - limited and the expansion of agricultural land can only partly explain the observed increases in production.
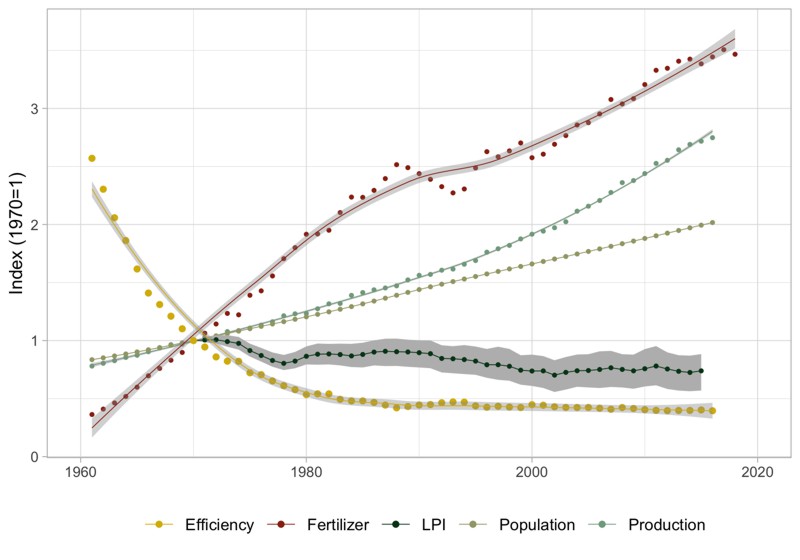
The enormous increases in yields in recent decades have become possible primarily through intensification of land use: more fertilisers and pesticides have been applied and areas equipped with irrigation systems are increasing. Thus one can assume, that a further rapid increase of production is hard to achieve, as this process of intensification has taken place at very many site arround the world. As a result, the maximum annual increase in production might already have reached for mutlipple renewable resources, see "Peak Year".
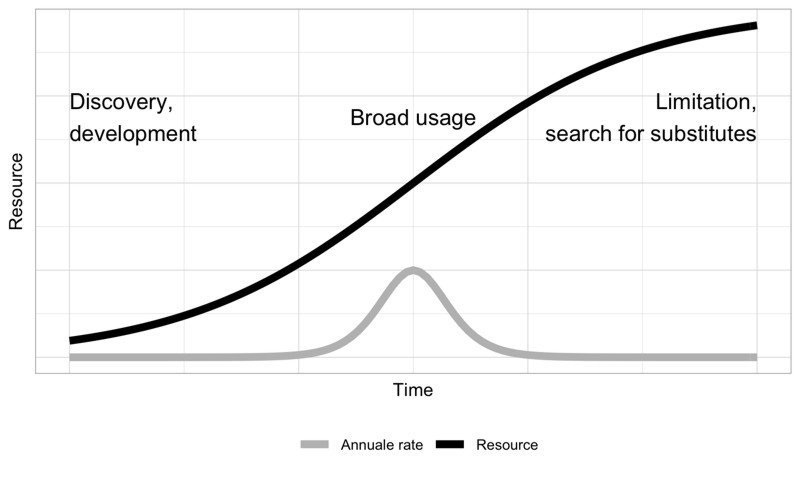
The term "peak" became well-known in the 1970s, when the decline in the production of crude oil from a certain year onwards was discussed as "peak oil". For the analysis at hand (and the interactive Webtool) no models were used to search for a peak year of renewable resources, as has been done previously in the case of "peak oil", but instead a robust statistical method was used, which allowed to account for different production or extraction methods capturing also innovations (Seppelt et al. 2014).
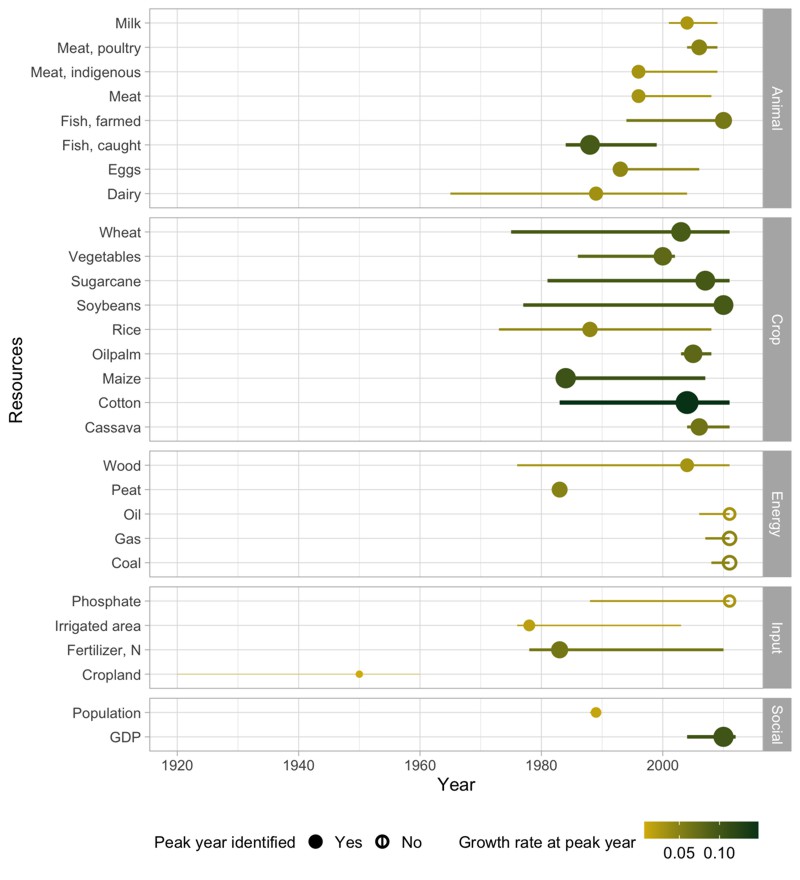
In the interactive Webtool, it is possible to analyse individually different countries and the 35 most important crops according to the existence of peak years. Peak years for all other resources (especially animal products) were only analysed within the original publication.
Figures based on (Seppelt et al. 2014).
A stable supply of agricultural products is of great importance in the face of a steadily growing world population and climate change. One factor to increase production stability is crop diversity: A greater number of different crops reduces the risk of complete crop failure, as not all crops are usually equally affected by plant diseases, pests or extreme climatic events (e.g., floods or droughts) (Egli et al. 2020, Egli et al. 2021, Egli et al. 2021).
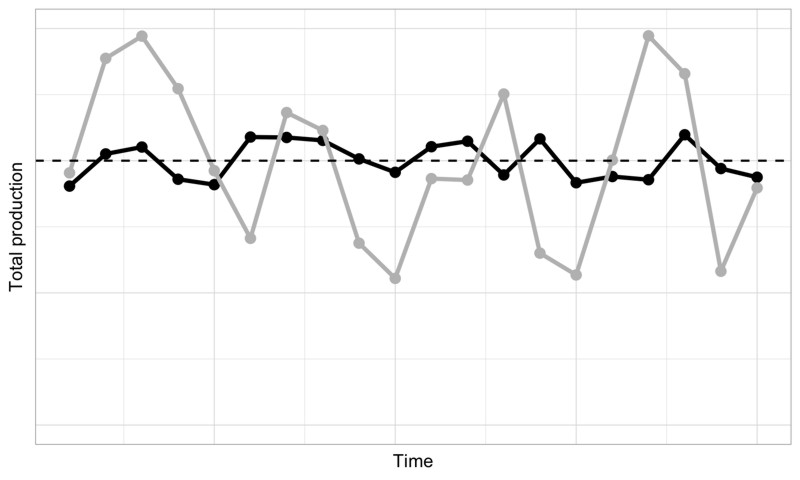
Globally, crop diversity is one of the most important stabilising factors, along with fertiliser use, while climatic instability, in particular, reduce production stability (Egli et al. 2020). Moreover, production stability has decreased over the past decades.
More stable production can also be achieved through intact interactions of fungi and microorganisms in the soil, as well as pest regulation through birds and insects. Diverse and small-scale land management, as well as the continuous breeding of crops to adapt them to changing external conditions, can also stabilise yields (Tester et al. 2010, Egli et al. 2021).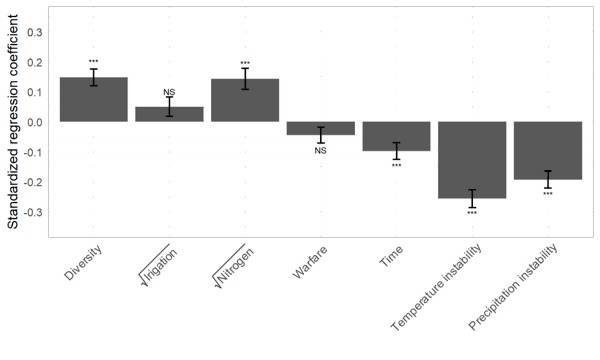
Figure based on Egli et al. 2020.
To increase food security, it is important that production losses of several crops do not occur simultaneously, i.e., that they are as asynchronous as possible (Mehrabi & Ramankutty 2019). A higher diversity of agricultural crops has a positive effect on asynchrony, especially if crop growth reacts differently to changing conditions (Egli et al. 2020, Egli et al. 2021).
For example, asynchrony of cultivated crops can result from differences in the temporal sequence in which crops are sown and harvested, or in the variation of phenology, i.e., the different temporal development in the vegetation period. Asynchrony also arises from the cultivation of crops that react differently to climatic conditions or have different management requirements. The more different the crops are, the lower the risk that a storm, flood or other events will destroy the entire harvest.
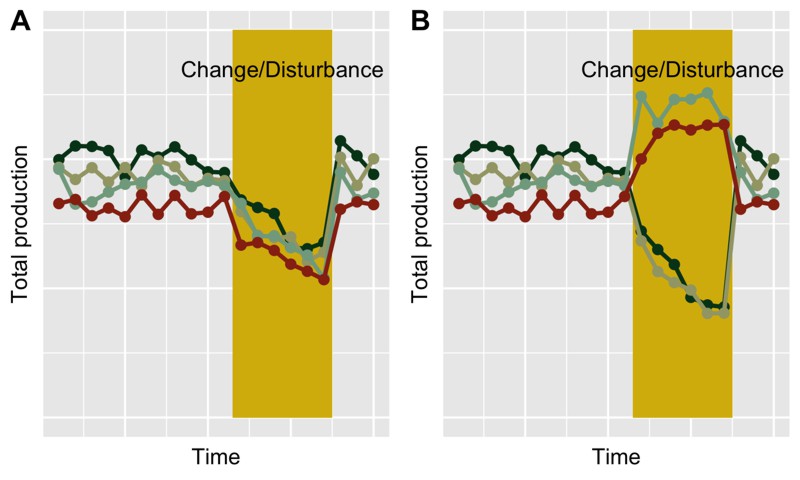
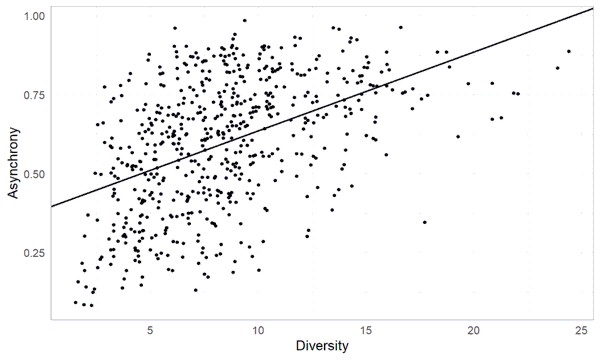
Figures based on (Egli et al. 2020)
According to the Intergovernmental Platform on Biodiversity and Ecosystem Servbices (IPBES), the way humans currently use land is the key driver of biodiversity decline (Diaz et al. 2019). As long as increased agricultural production through higher management intensity is seen as the prevalent strategy to achieve food security, land use will continue to be the key driver of biodiversity decline.
What is overlooked is that agricultural production depends on functioning ecosystems, which would not be possible without intact biodiversity. Biodiversity thus becomes a decisive agricultural production factor: birds and insects eat pests, soil animals, fungi and bacteria ensure fertile soil. If agriculture is intensified, this increases harvests in many cases, but at the same time also reduces biodiversity and thus endangers agricultural yields in the long term (Beckmann et al. 2019, Zabel et al. 2019).
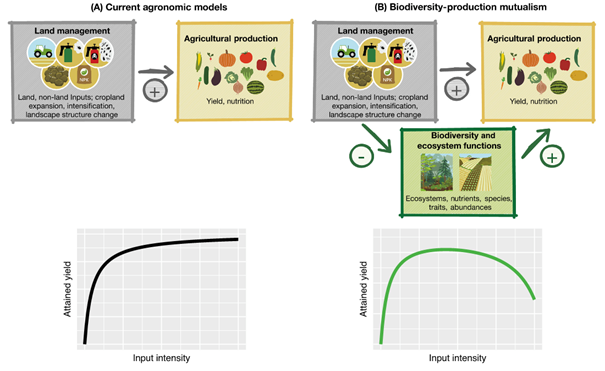
Therefore, other solutions are needed. These include, for example, more diverse land management with small-scale structures and continuous development of crops that are resistant to plant diseases and can better utilise nutrients (Seppelt et al. 2020).
- Daily Mirror, UK, 28.1.2015: "Peak chicken" was 2006 - how food production isn't keeping pace with population. (Print/online)
- The Independent, UK, 28.1.2015: Have we reached 'peak food'? Shortages loom as global production rates slow” (Print/online )
- ORF, Austria: Das Riesenwachstum ist vorbei „Peak Food“ ist das neue „Peak Oil“ (online)
- Nature, UK, 14.01.15: Resource use peaks worldwide (Print/online)
- TopAgrar, German, 19.1.2015: Nachwachsende Rohstoffe nicht unbegrenzt verfügbar (online)
- Deutschlandfunk, Germany, 5.03.2015: Der Kampf um die Böden (Radio/online)
- Tagesspiegel, Germany, 21.02.15: Schluss mit der Agrarromantik! (Print)
The current way of managing land is very frequently guided by a historical perspective that sees the last 10,000 years of human expansion on the planet mostly as a success story with a multitude of innovations. To present what has promoted or inhibited this development would take us too far here. We recommend the books by James Suzman or by Juval Harari, which shed light not only on the ecological, but also on the social and economic aspects of this transformation.
- Sapiens: A Brief History of Humankind (London: Harvill Secker, 2014) ISBN 978-006-231-609-7
- Homo Deus: A Brief History of Tomorrow (2016), ISBN 978-1910701881
- Suzman J., 2020, Work: A History of How We Spend Our Time, Bloomsbury, ISBN 978-1526604996
Global analyses and evaluations, such as those presented here, ignore regional and local conditions. To get closer to this and to get a better idea of the way of life of the most different people on earth, we recommend a visit to the site DollarStreet of gapmider.org. Depending on the available income from less than 2 US-$ per day up to more than 32 US-$ per day (all in English) you can find countless authentic photos on

