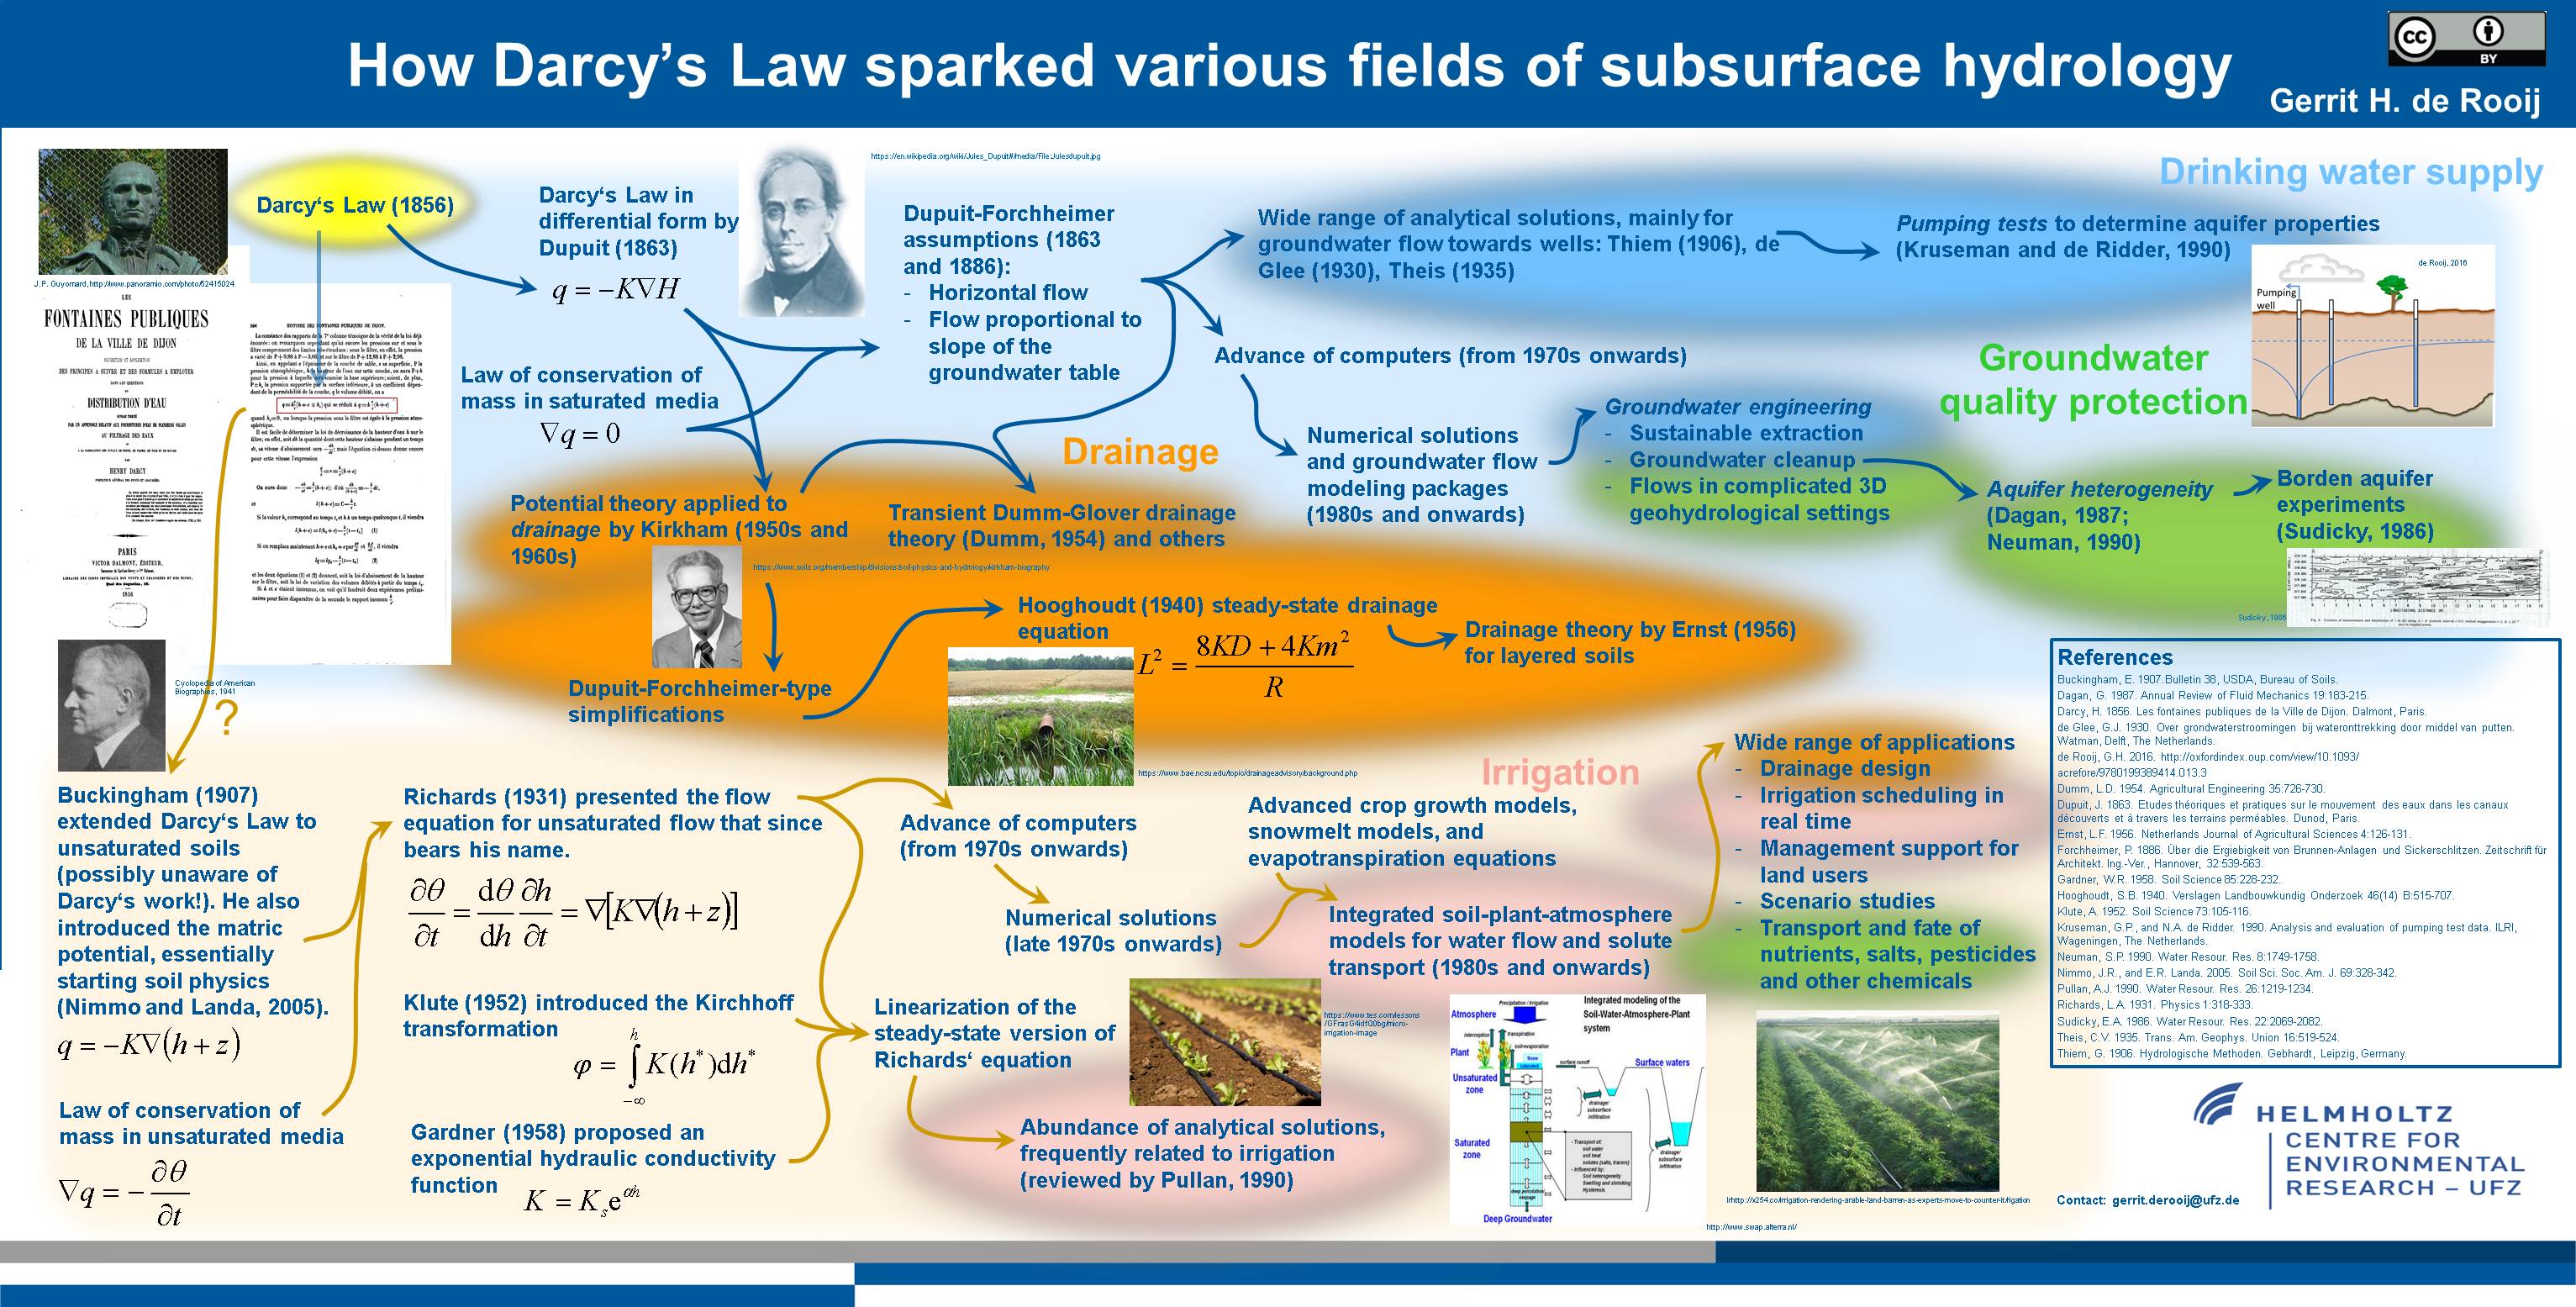
History of subsurface hydrology starting with Darcy's Law
The full hypertext on which this graphical representation is based can be found in the Oxford Research Encyclopedia on Environmental Science.
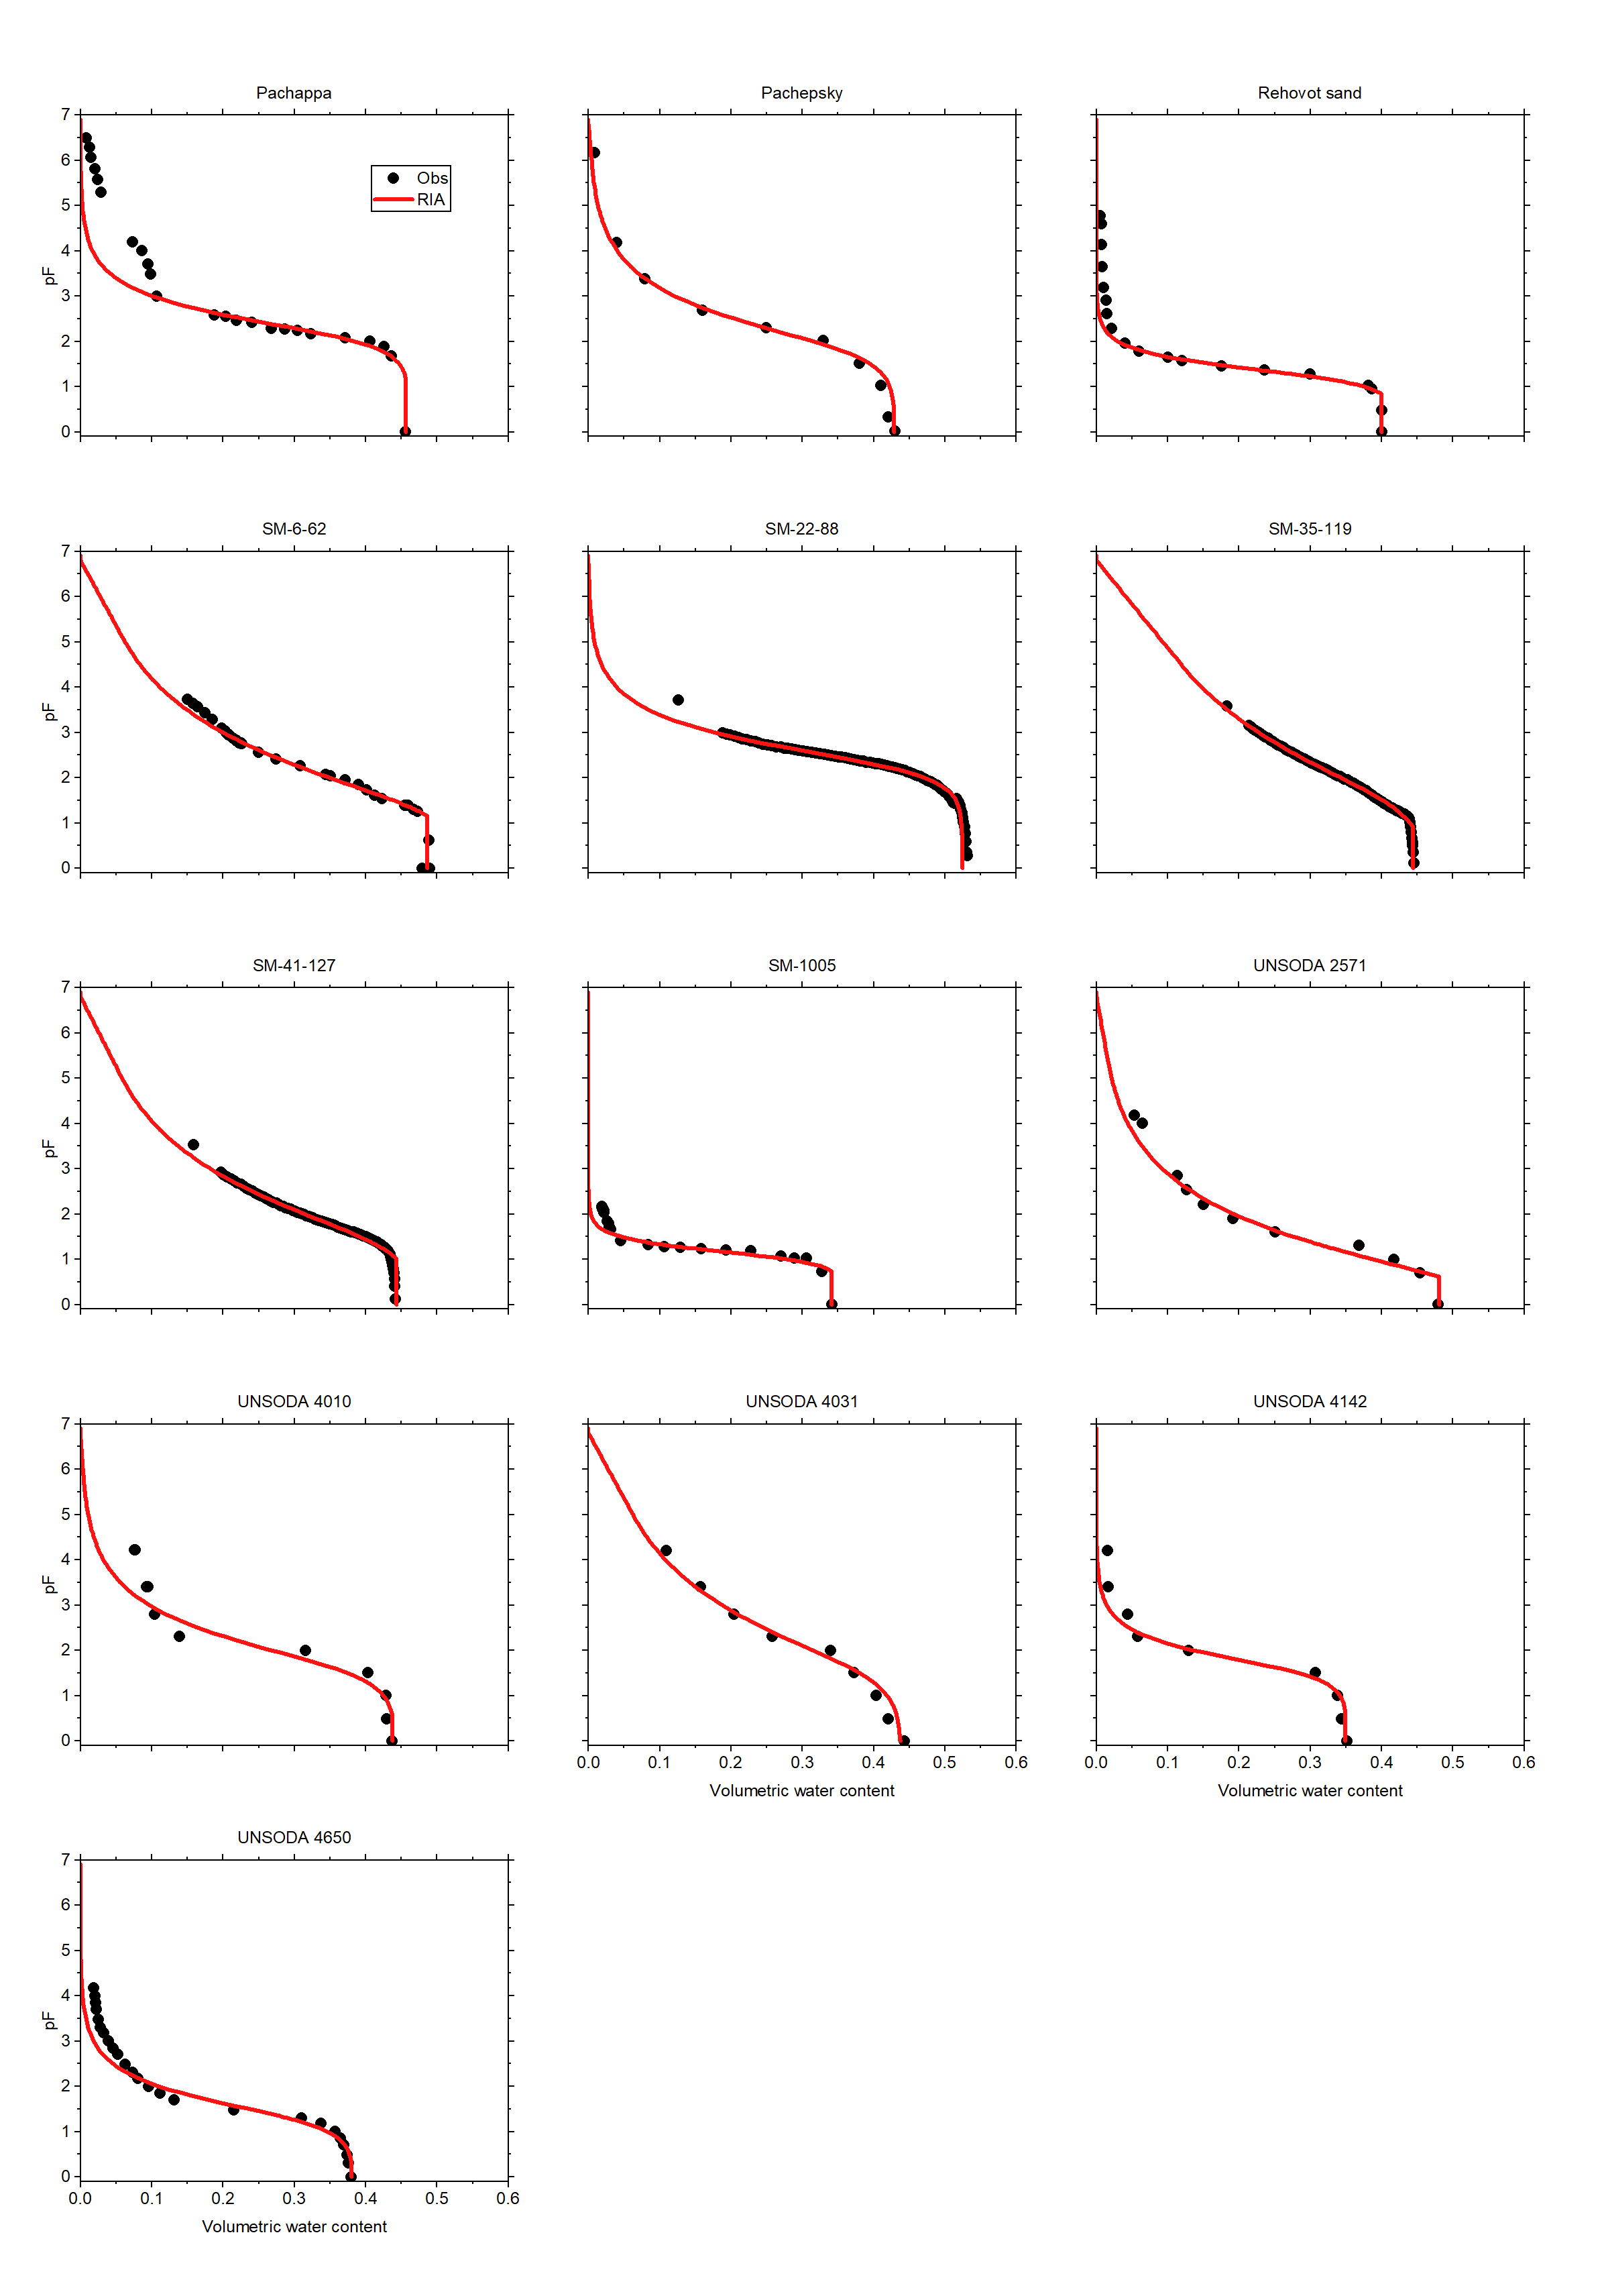
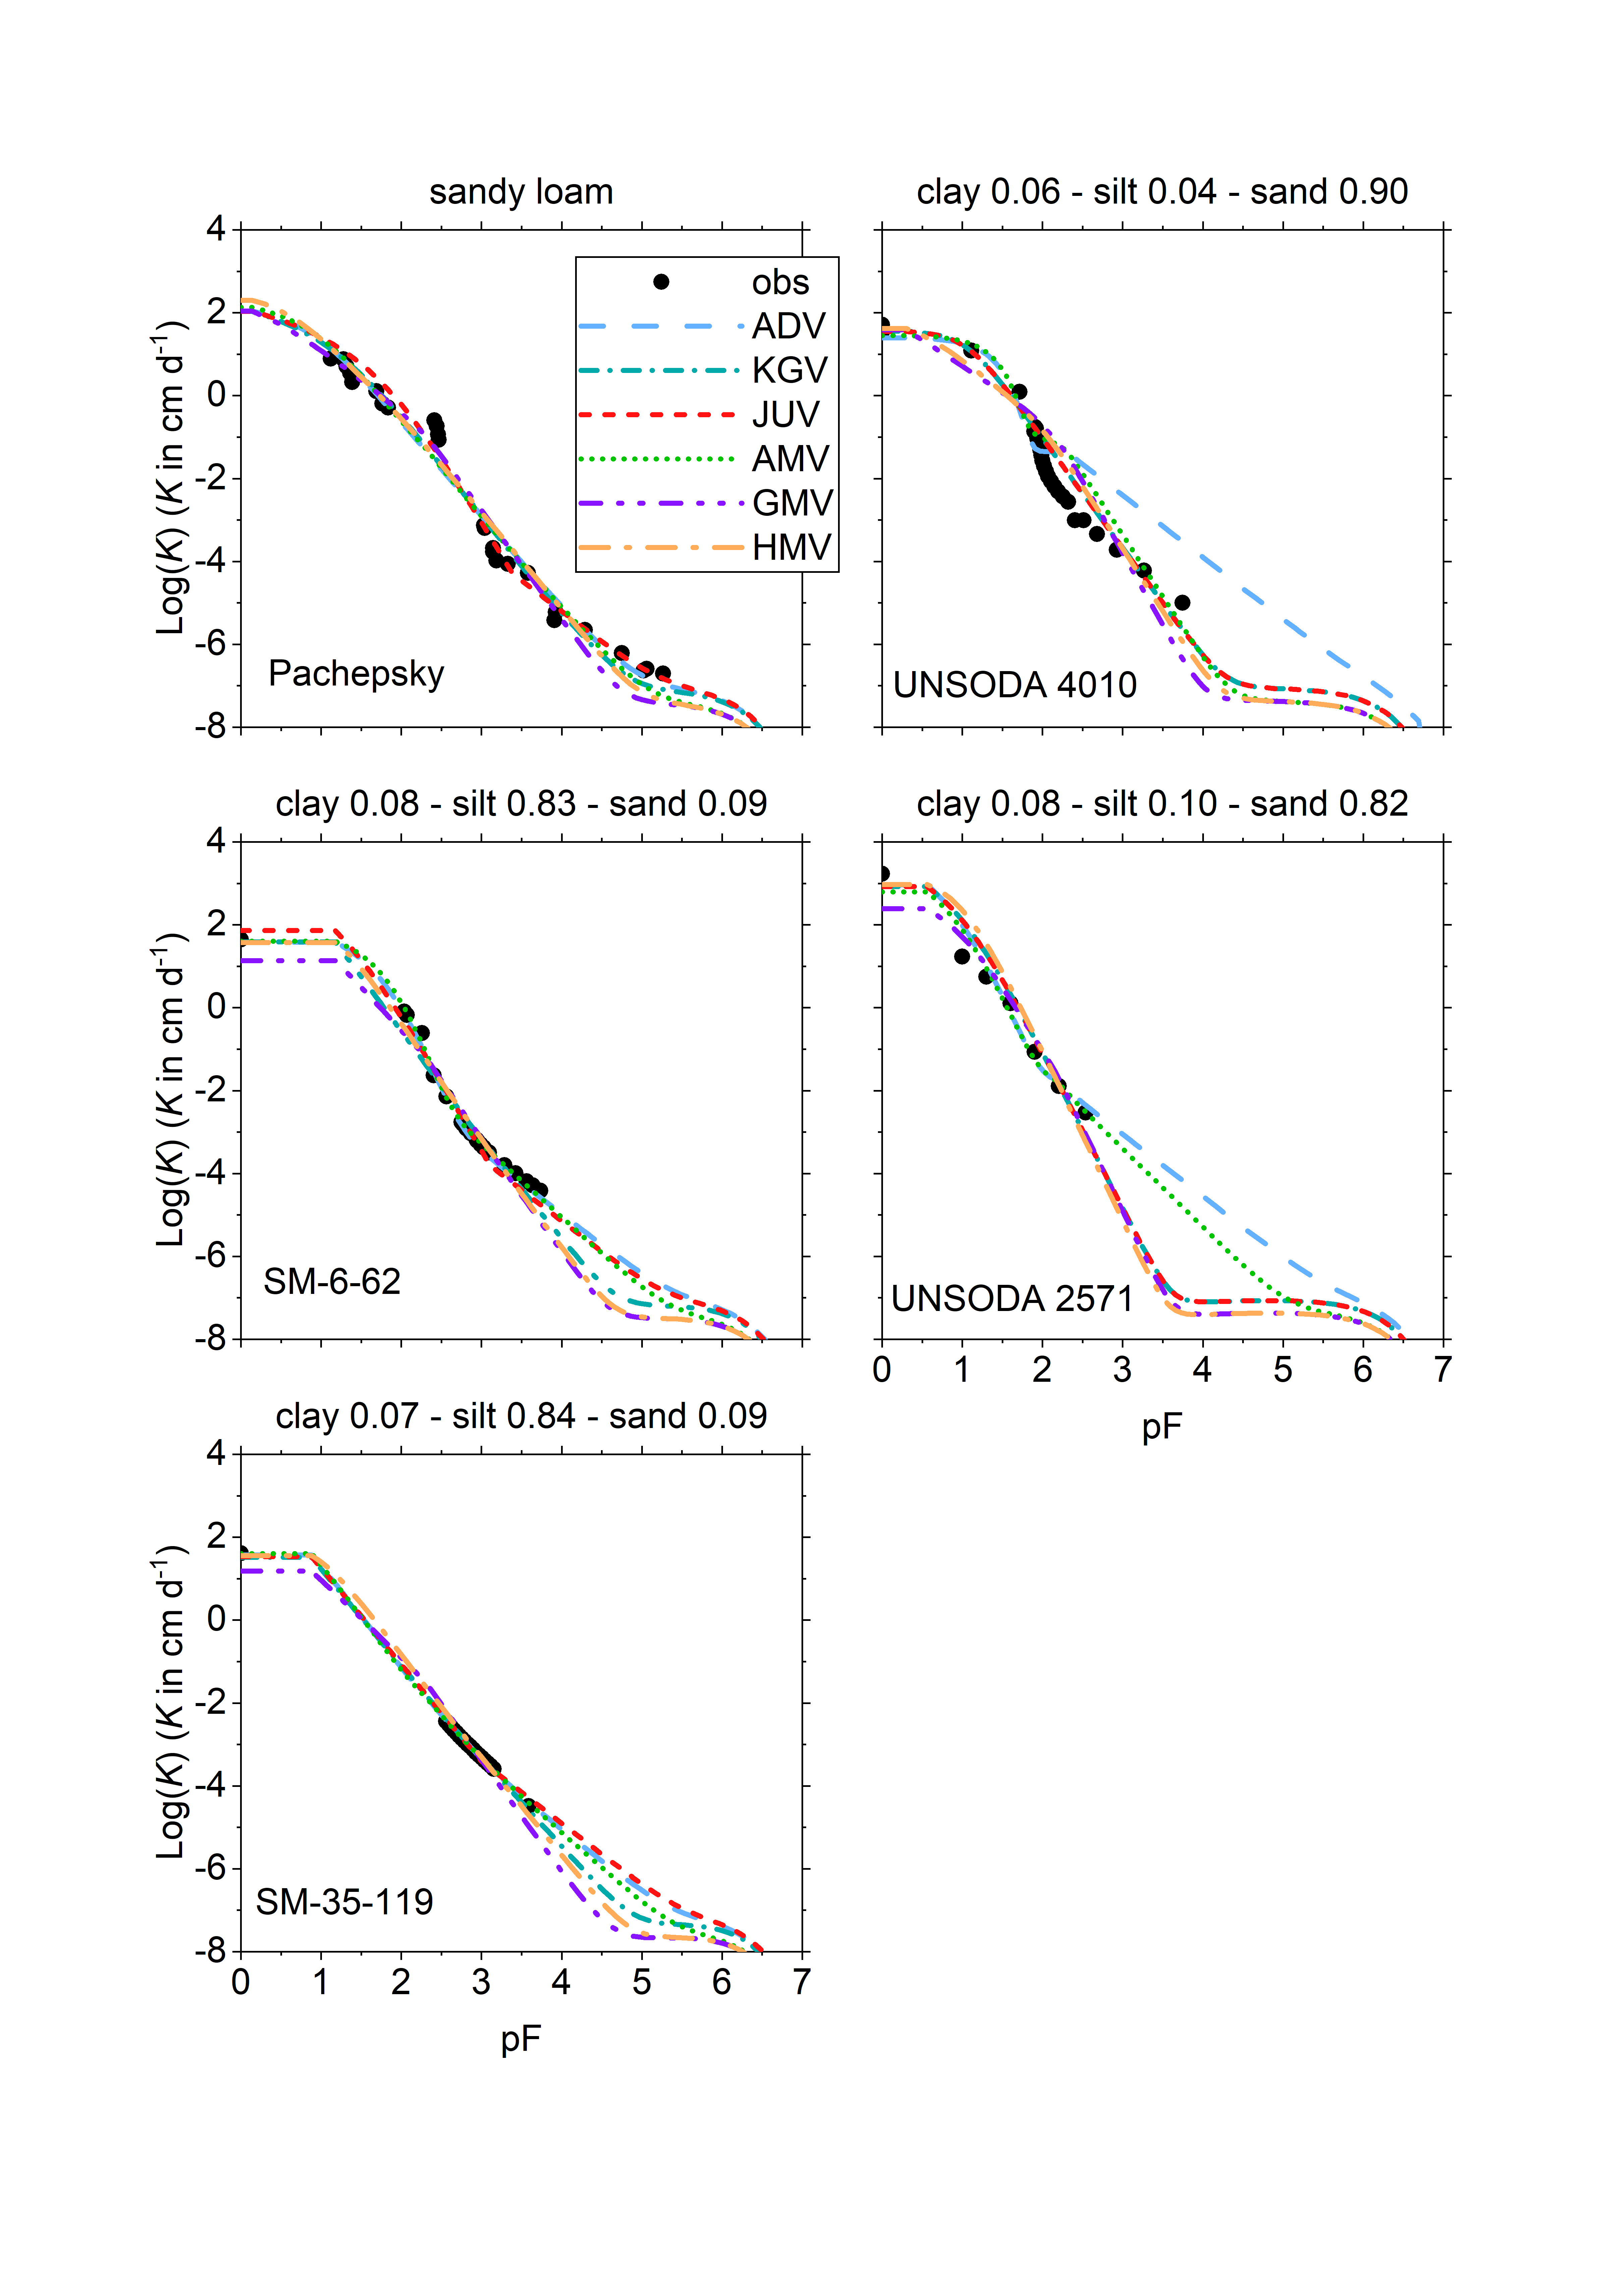
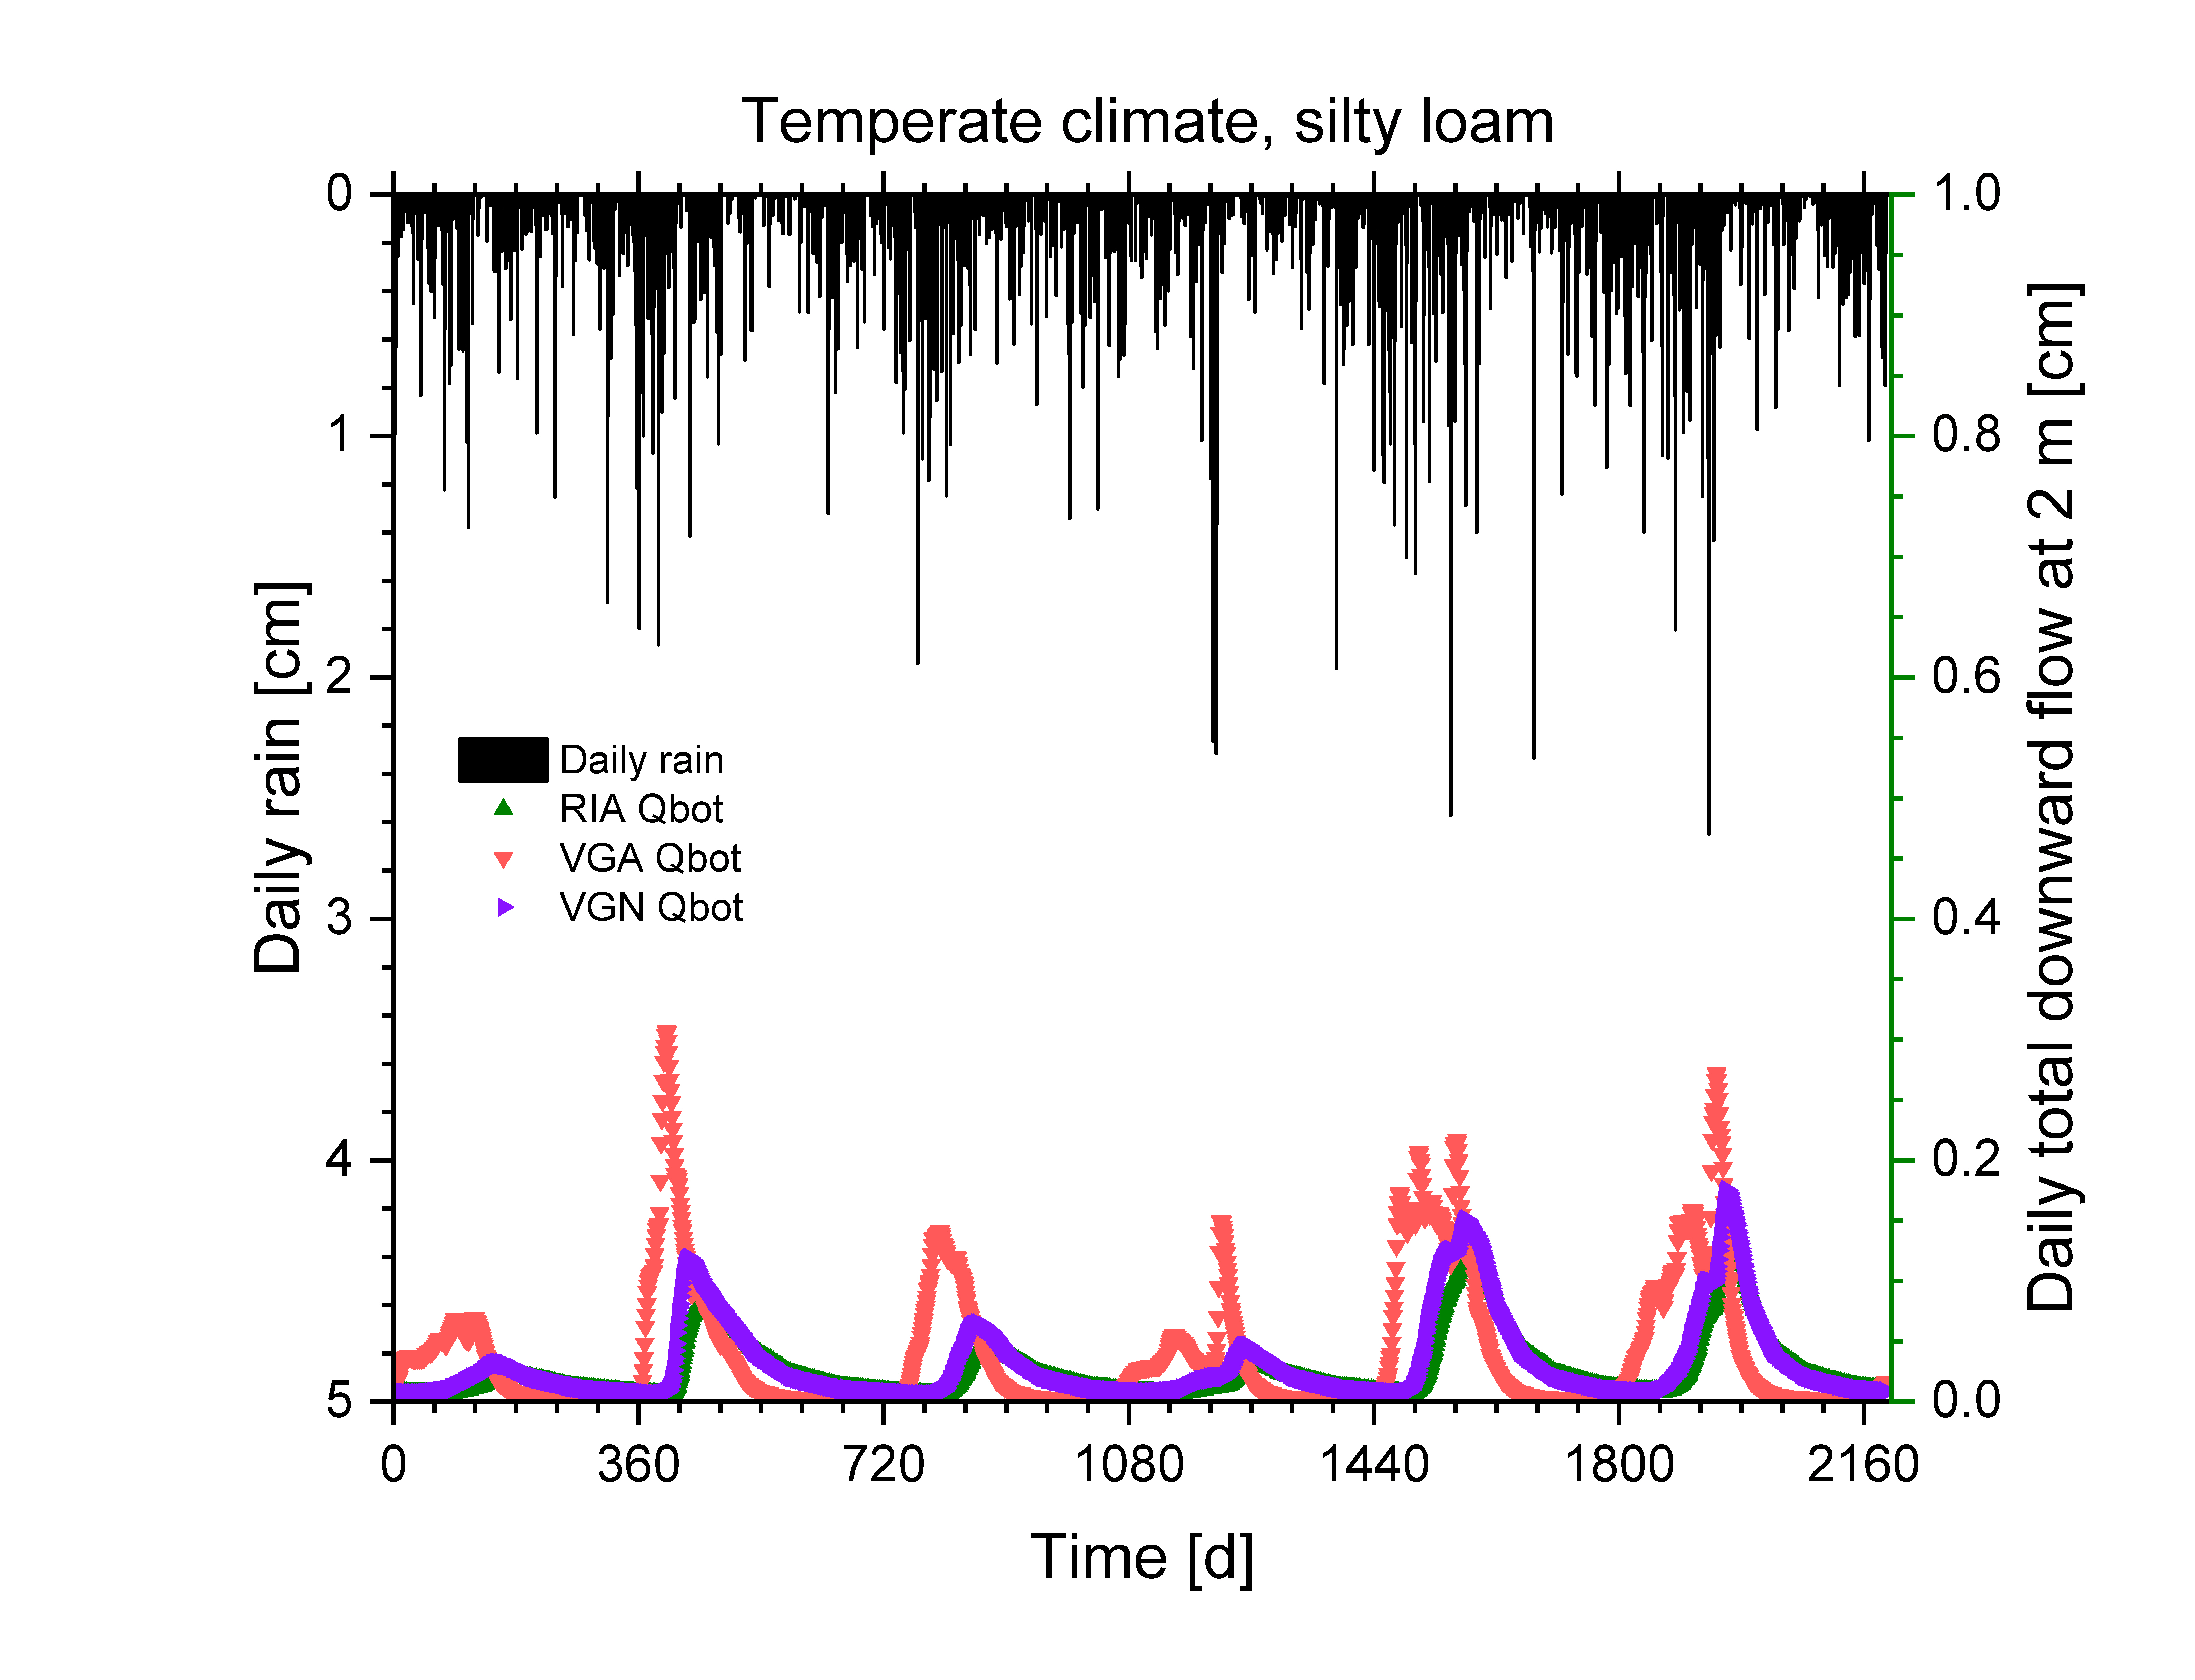
Improved functions for the soil water retention curve and the unsaturated soil hydraulic conductivity curve
Storage and flow of water in soils is governed by curves that describe the soil water content and the conductivity of the soil to flowing water, both as a function of the matric potential (a measure for the force needed to dry the soil a little bit further from the water content at the current value of the matric potential).
Most of the existing functions suffered from at least one of two problems: 1) an asymptotic non-zero water content as the soil becomes drier, possibly leading to the physical impossibility of calculating a amount of water in a soil column that is larger than the available pore space (the space between the grains), and 2) a non-zero slope of the water content at zero matric potential, which implies the presence of a pore with an infinite cross-section. The latter leads to an infinite slope of the conductivity curve at saturation, which is also physically impossible.
The new RIA parameterization of the retention curve has a logarithmic dry branch that reaches zero water content at a finite matric potential, eliminating the asymptote. It has an intermediate branch that can be sigmoidal (often the case for soils with a wide range of grain sizes, and for fine soils) or approximate a power law (which can be the case if a soil has coarse grains). This branch terminates at the non-zero air-entry value, beyond which the soil is saturated (the wet branch). This forces the derivative of the conductivity curve to be finite.
Several new conductivity curves were developed and tested. In recent years, conductivity functions have been published that describe the conductivity of the part of the soil that has water-filled capillaries, and functions that so the same for the part of the soil in which water is only present as films on the soil grains, with the rest of the pores filled with air. A model that adds these conductivities performs well. But a model that uses the film function of the soil is drier that a particular matric potential and the capillary function if the soil is wetter performs about equally well, and needs one parameter less.
Public-domain software to fit these functions to data can be downloaded, together with user manuals and example files.
The program RIAfitter for the soil water retention curve:
de Rooij, G. 2024. Fitting the parameters of the RIA parameterization of the soil water retention curve (2.0), Zenodo [code], doi: 10.5281/zenodo.6491978.
The program KRIAfitter for the unsaturated soil hydraulic conductivity curve:
de Rooij, G. 2024. Fitting the junction model and other models for the unsaturated hydraulic conductivity curve: KRIAfitter, Zenodo [code], doi: 10.5281/zenodo.14047942.
Relevant papers, published so far:
de Rooij, G.H., Mai, J., and Madi, R. 2021. Sigmoidal water retention function with improved behaviour in dry and wet soils, Hydrol. Earth Syst. Sci., 25, 983–1007, doi: 10.5194/hess-25-983-2021.
de Rooij, G.H. 2022. Technical note: A sigmoidal soil water retention curve without asymptote that is robust when dry-range data are unreliable, Hydrol. Earth Syst. Sci., 26, 5849–5858, doi: 10.5194/hess-26-5849-2022.
de Rooij, G.H. 2024. Averaging or adding domain conductivities to calculate the unsaturated soil hydraulic conductivity, Vadose Zone J., e20329, doi: 10.1002/vzj2.20329.
Hydrological controls on export of dissolved organic carbon (DOC) to streams
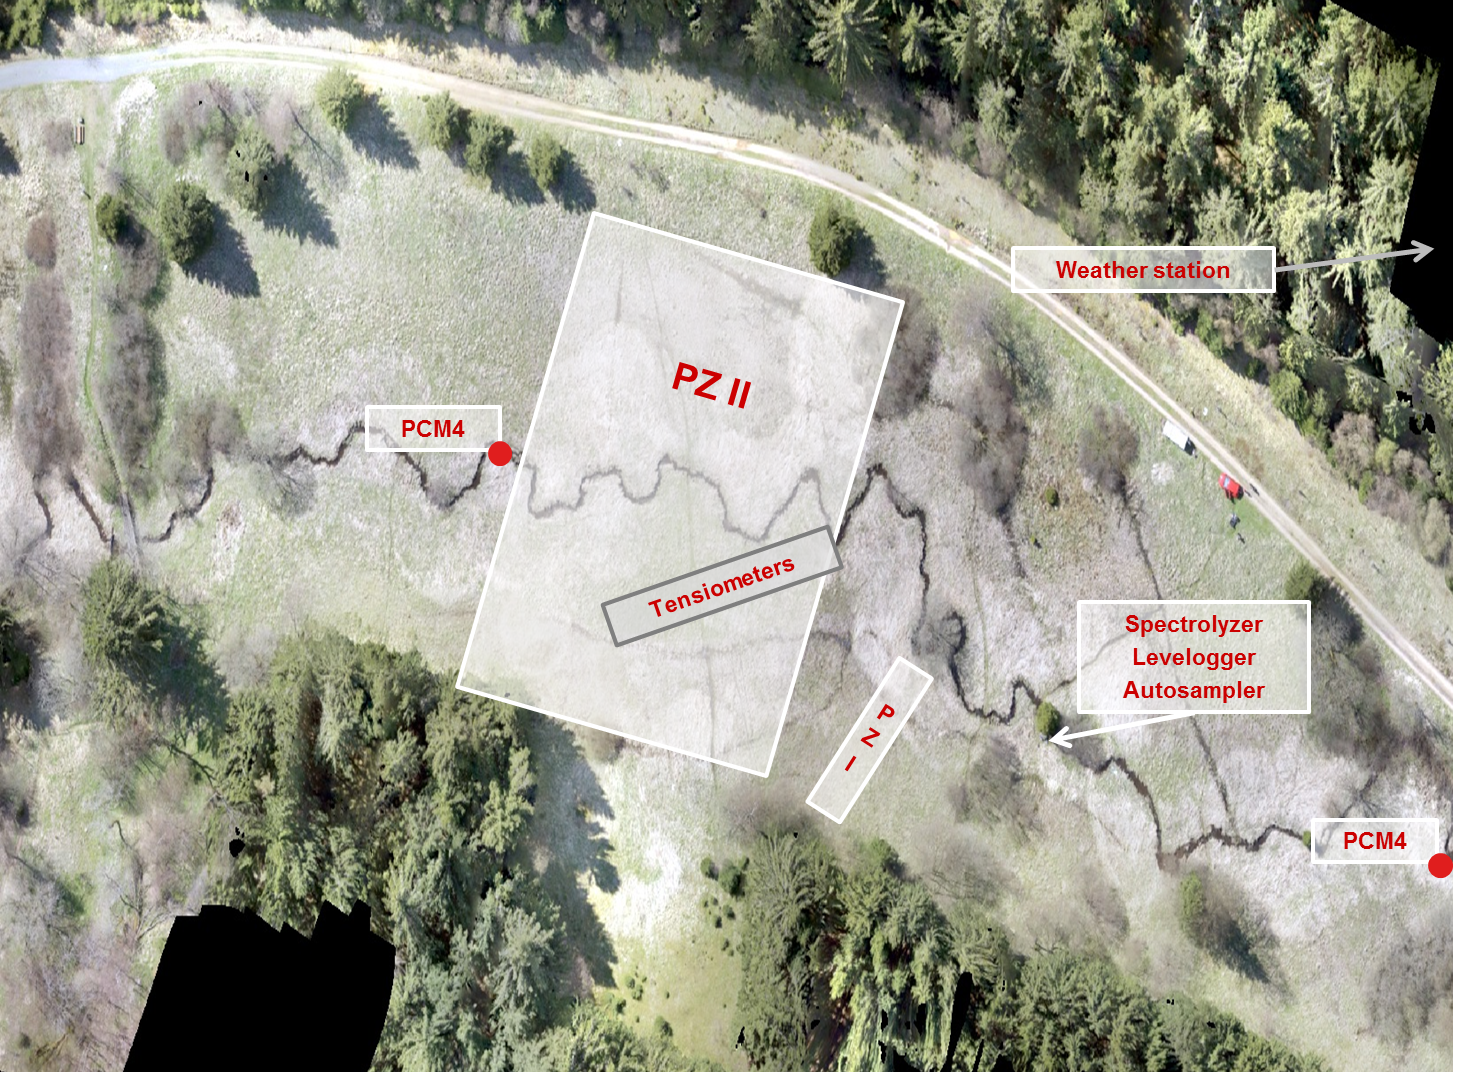
Atmospheric deposition of nitrogen related to NOx emissions over the past decades immobilized soil organic matter, and it built up in the soil. Now that these depositions have gone down, reduction processes mobilize the organic matter. Its release in surface water requires expensive treatment if this water is used for drinking water. We are running a monitoring campaign in a forested catchment in the Harz mountains to elucidate the hydrological controls on the mobilization and transport of organic carbon, in conjunction with the hydrochemistry of organic matter, iron, and other key compounds.
Large-scale subsurface hydrology
We developed various ways to characterize water flow and solute transport at scales from the field to the small catchment (several square kilometers). We were able to model the discharge by conceptualizing a drained lowland catchment as a time-variable probability distribution function (pdf) of depth-to-groundwater. Local evapotranspiration rates, overland flow, flow to drains, and flow to ditches and streams were all functions of the local groundwater depth, and the catchment-scale fluxes obtained by integrating over the pdf. For nitrate, we developed a conceptual model that takes into account rapid overland flow, shallow groundwater flow, and deep groundwater flow with denitrification. We also explored time-variable travel time distributions.
In a different approach, we explored the possibility to infer the change in water storage in an area with clay soils by observing through satellite-based radar interferometry the change in elevation of the soil surface.
Selected papers
Corwin, D.L., J. Hopmans, and G.H. de Rooij (eds.) 2006. From field- to landscape-scale vadose zone processes: scale issues, modeling, and monitoring. Special section in Vadose Zone Journal 5.
Lennartz, B., B. Tiemeyer, G. de Rooij, and F. Doležal. 2010. Artificially drained catchments – From monitoring studies towards management approaches. Special section in Vadose Zone Journal 9.
te Brake, B., R.F. Hanssen, M.J. van der Ploeg, and G.H. de Rooij. 2013. Satellite based radar interferometry to estimate large-scale soil water depletion from clay shrinkage: possibilities and limitations. Vadose Zone Journal, doi:10.2136/vzj2012.0098.
van der Velde, Y., G.H. de Rooij, and P.J.J.F. Torfs. 2009. Catchment-scale non-linear groundwater-surface water interactions in densely drained lowland catchments. Hydrology and Earth System Sciences, 13:1867-1885. www.hydrol-earth-syst-sci.net/13/1867/2009/.
van der Velde, Y., G.H. de Rooij, J.C. Rozemeijer, F.C. van Geer, and H.P. Broers. 2010. The nitrate response of a lowland catchment: on the relation between stream concentration and travel time distribution dynamics. Water Resour. Res., 46, W11534. doi:10.1029/2010WR009105.
Limitations on the validity of Darcy’s Law
At the Darcian scale, water fluxes in soils and aquifers are proportional to gradients in the hydraulic potential. At what scale does the proportionality between the averaged flux and the gradient of the averaged potential lose its validity? And what (if any) law emerges instead at this scale?
Public domain code
Dupuitflow (Fortran90)
Selected papers
de Rooij, G.H. 2009. Averaging hydraulic head, pressure head, and gravitational head in subsurface hydrology, and implications for averaged fluxes, and hydraulic conductivity. Hydrology and Earth System Sciences, 13:1123-1132. www.hydrol-earth-syst-sci.net/13/1123/2009/.
de Rooij, G.H. 2010. Comments on “Improving the numerical simulation of soil moisture-based Richards equation for land models with a deep or a shallow water table.” J. Hydrometeor. 11:1044-1050. doi:10.1175/2010JHM1189.1
de Rooij, G.H. 2011. Averaged water potentials in soil water and groundwater, and their connection to menisci in soil pores, field-scale flow phenomena, and simple groundwater flows. Hydrol. Earth Syst. Sci. 15:1601–1614, www.hydrol-earth-syst-sci.net/15/1601/2011/, doi:10.5194/hess-15-1601-2011.
de Rooij, G.H. 2012. Transient flow between aquifers and surface water: analytically derived field-scale hydraulic heads and fluxes. Hydrol. Earth Syst. Sci. 16:649-669, www.hydrol-earth-syst-sci.net/16/649/2012/, doi: 10.5194/hess-16-649-2012.
de Rooij, G.H. 2013. Aquifer-scale flow equations as generalized linear reservoir models for strip and circular aquifers: links between the Darcian scale and the aquifer scale. Water Resources Research 49, 8605-8615, doi:10.1002/2013WR014873.
Movement of liquid water and water vapour in soils in (semi-)arid regions
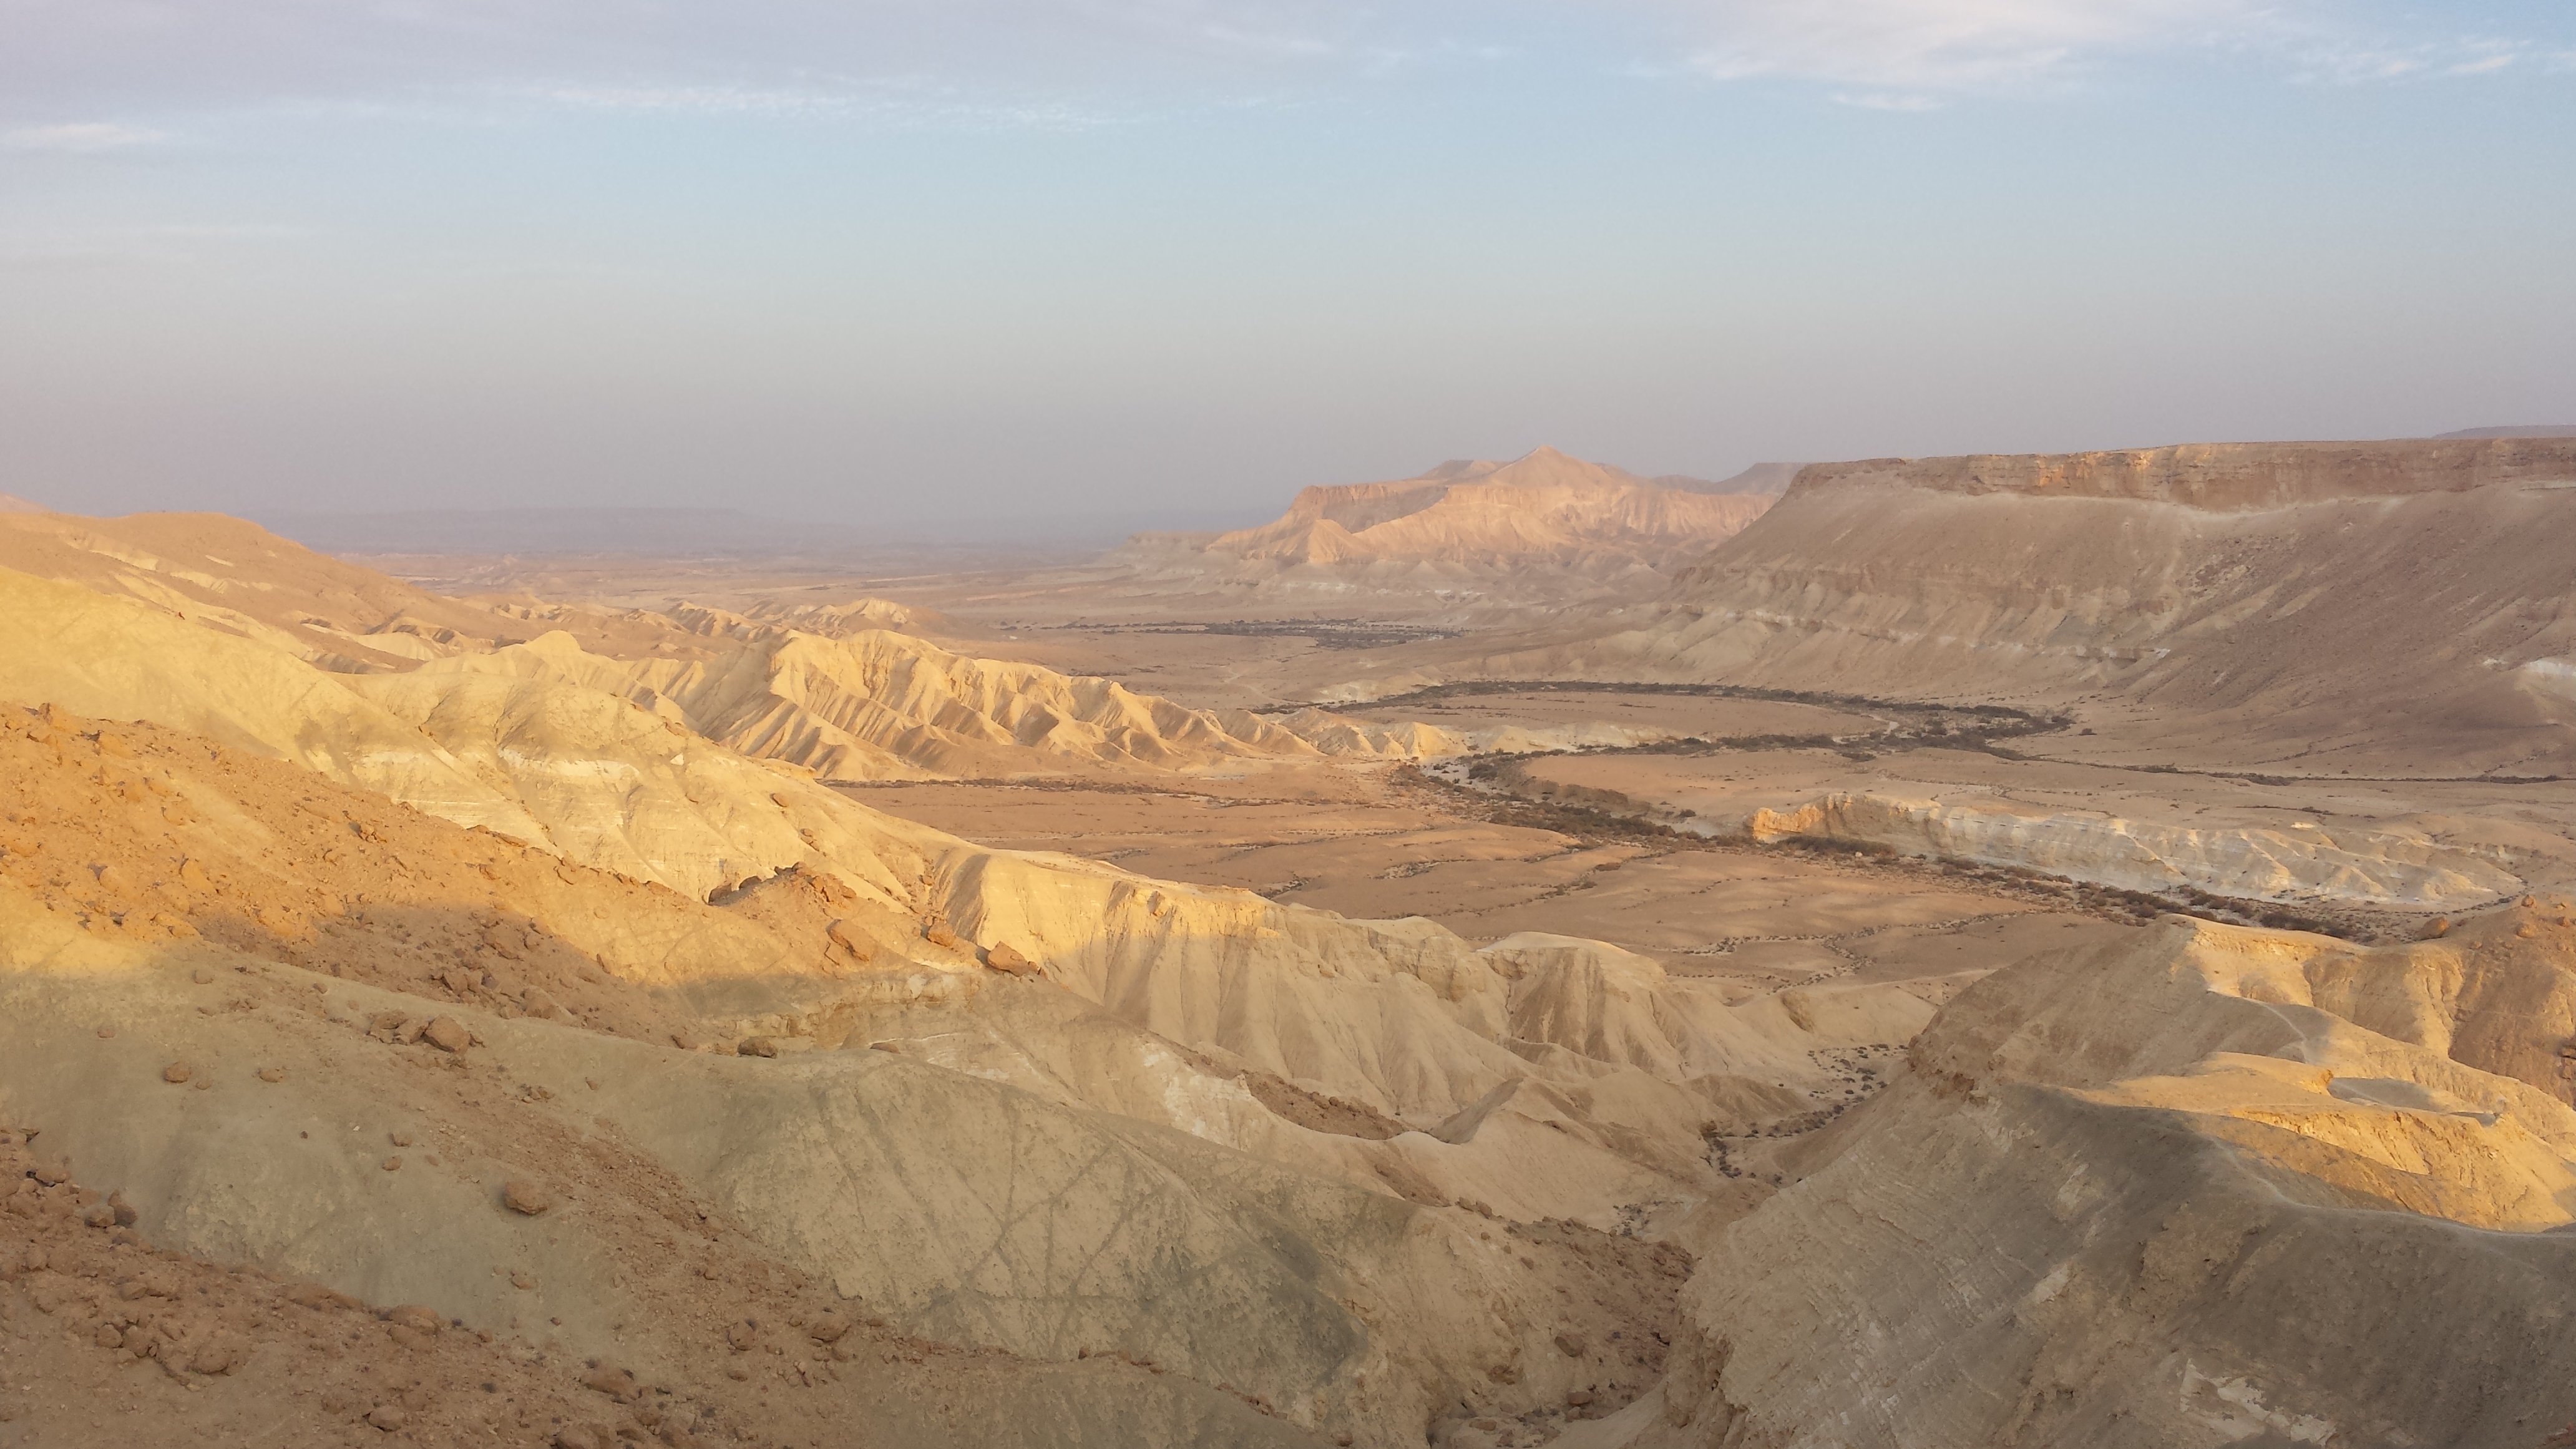
In (semi-)arid regions, acute existential problems and fundamental classical soil physics meet. Pastoral or hunter-gatherer communities learned how to survive in conditions that only just support human life. Climate change now threatens their way of life, which is closely linked to the terrestrial hydrological cycle, notably the amount and temporal distribution of precipitation and its fate once it infiltrates into the soil. One aspect of this is the contribution of the flow of liquid water and water vapour to recharge of and water losses from aquifers below deep vadose zones. We try to improve the parameterization of the soil hydraulic functions to make them better suited for these conditions and carry out long-term simulations to examine the effect of rainfall characteristics on groundwater recharge.
Part of this work revolves around testing and improving parameterizations of parametric expressions for the soil hydraulic properties (Madi et al., 2018). We established a subset of 21 soils for the UNSODA database, and fitted six parameterizations to the soil water retention data. Tabulated forms of these curves and the derived unsaturated hydraulic conductivity curves are given in an Excel file (see download link below).
Selected papers
Madi, R., G.H. de Rooij, H. Mielenz, and J. Mai. 2018. Parametric soil water retention models: a critical evaluation of expressions for the full moisture range. Hydrol. Earth Syst. Sci. 22:1193-1219. Doi: 10.5194/hess-22-1193-2018.
Schulz, S., G.H. de Rooij, N. Michelsen, R. Rausch, C. Siebert, C. Schüth, M. Al-Saud, and R. Merz. 2015. Estimating groundwater recharge for an arid karst system using a combined approach of time-lapse camera monitoring and water balance modelling. Hydrol. Process. 30:771-782. Doi: 10.1002/hyp.10647
Generating artificial local weather records for data-sparse conditions
Many areas of the world have limited resources and infrastructure for monitoring weather data. Data records may also be insufficiently long due to various causes (significant land use changes, political instability, etc.). In other cases one might be interested in future scenarios under a changing climate. If one wishes to calculate actual evapotranspiration, groundwater recharge, crop growth, etc., weather data are needed. A relatively simple weather generator is under development to provide artificial weather records (mean, minimum, and maximum daily temperatures, daily potential evapotranspiration, hourly, daily, monthly, and annual rainfall). The current version is operational and downloadable from this website. It runs on standard laptop and desktop computers.
Public domain codes
Temperature and evapotranspiration generator: TheHeatIsOn (Fortran90)
Rainfall generator: WhollStopTheRain (Fortran90)
Older work: Spatio-temporal distribution of vertical solute transport in soils
If a water-soluble tracer is applied in a spatial uniform pulse to the soil surface, it is carried downward by infiltrating water. On its way down the tracer plume spreads, causing the tracer to arrive at a given depth over a range of times, and no longer uniformly distributed in space. The spatial spreading is characterized by the breakthrough curve. The deviation from spatial uniformity can be quantified if a multicompartment sampler is installed at the desired depth. The distribution of tracer amounts captured by the different sampling compartments can be quantified with the Beta-distribution. With the help of the Beta-distribution it is possible to determine the minimum radius an undisturbed soil column must have to avoid artificial constriction of the flow paths by the column wall.
By plotting the individual breakthrough curves of the sampling compartments next to each other, the leaching surface is obtained. It was shown that its scaled version can be seen as a bivariate probability density function (pdf) of the tracer appearing at a given place at a given time. By applying dilution theory to this pdf it is possible to infer the nature of the solute transport process from observations at a single depth.
Selected papers
Bloem, E., M. de Gee, and G.H. de Rooij. 2012. Parameterizing the leaching surface by combining curve-fitting for solute breakthrough and for spatial solute distribution. Transport in Porous Media, 92:667–685. doi: 10.1007/s11242-011-9927-2.
de Rooij, G.H., O.A. Cirpka, F. Stagnitti, S.H. Vuurens, and J. Boll. 2006. Quantifying minimum monolith size and solute dilution from multi-compartment percolation sampler data. Vadose Zone Journal 5:1086-1092. doi:10.2136/vzj2005.0101
de Rooij, G.H., and F. Stagnitti. 2000. Spatial variability of solute leaching: experimental validation of a quantitative parameterization. Soil Sci. Soc. Am. J. 64:499-504.
de Rooij, G.H., and F. Stagnitti. 2002. Spatial and temporal distribution of solute leaching in heterogeneous soils: analysis and application to multisampler lysimeter data. J. Contam. Hydrol. 54:329-346.
