Ocean Eddies Forecasting
As part of the MOSES Ocean Eddy Test Campaign, the “Meteor” research vessel expedition M160 took place off Cape Verde from November 23 to December 19, 2019. For the short and medium term planning of the field experiments mathematical models were used to determine the current and future three-dimensional distribution of temperature, salinity and currents in the study area. The Helmholtz-Zentrum Geesthacht (HZG) uses the Regional Ocean Modeling System (ROMS).
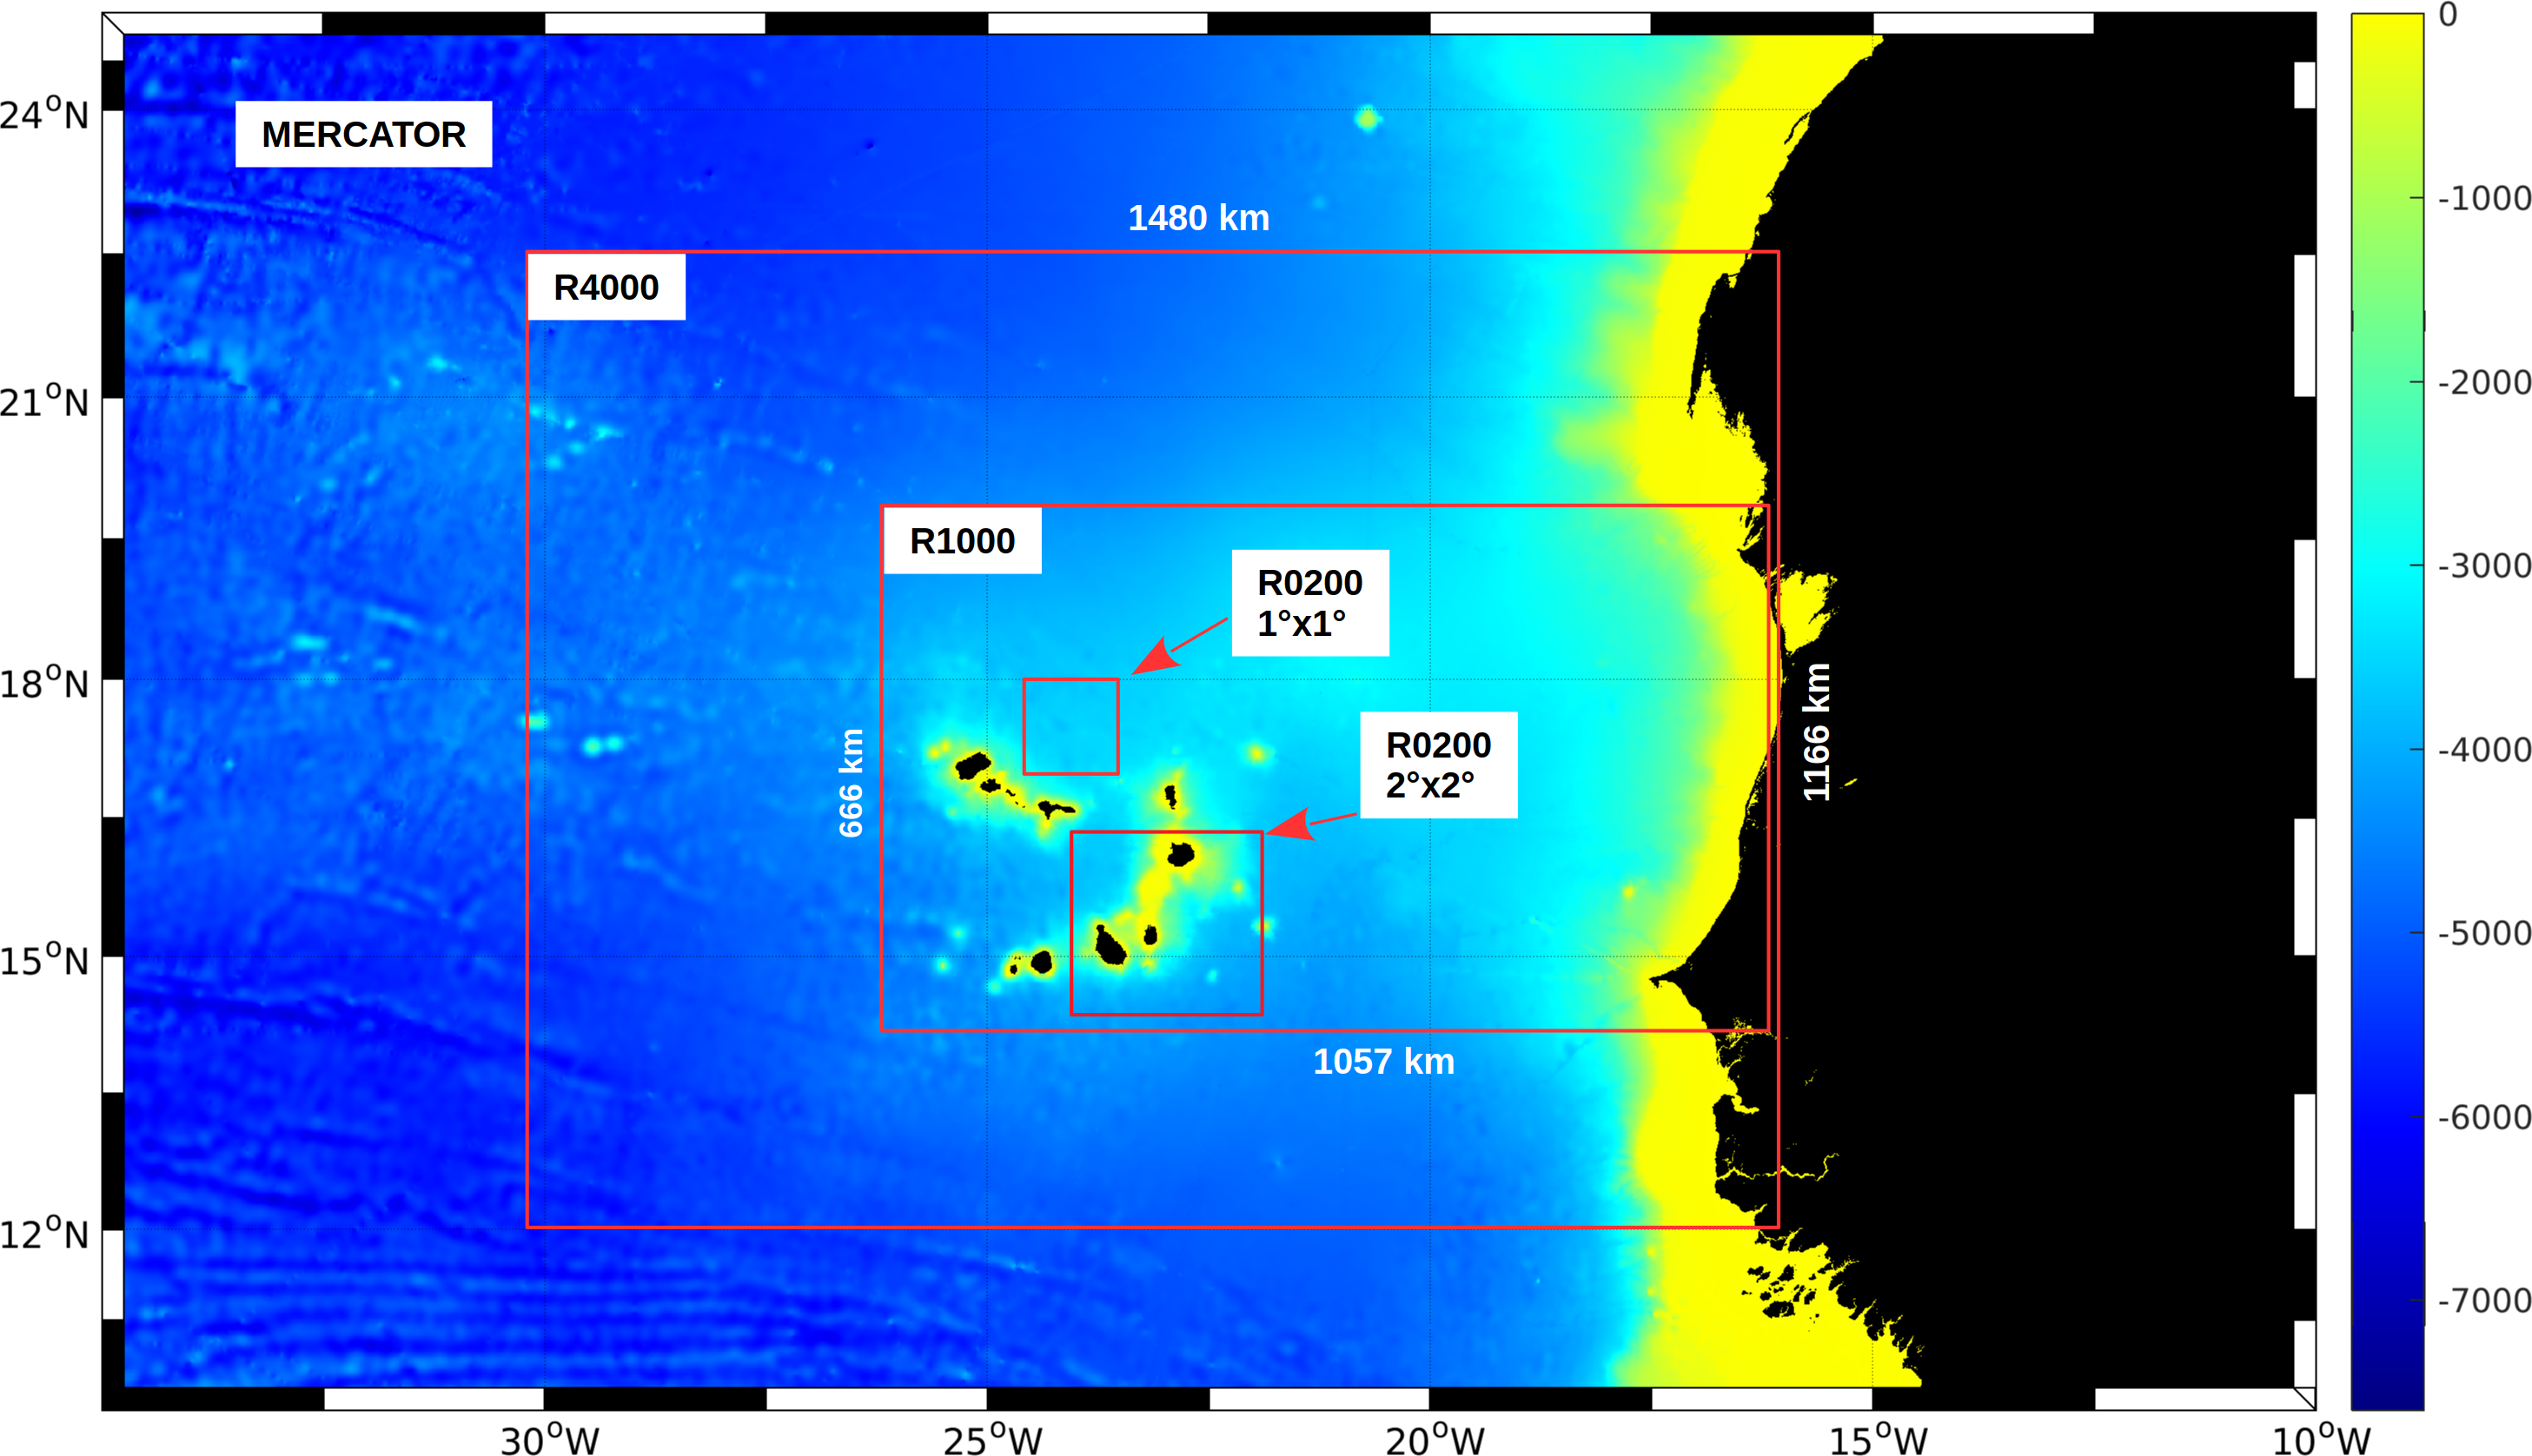
During the expedition the ROMS ocean circulation model was implemented in a triple-nested version. Starting point of this model chain is the global French MERCATOR model, which provides low-resolution forecasts for the entire world ocean. The ROMS model R4000 (with 4 km horizontal resolution) was nested into the MERCATOR model to refine the predictions of the global model (Fig. 1).

Fig. 1: The triple-nested model areas R4000, R1000 and R0200. The size and position of R0200 is arbitrary, however, it must lie completely within the R1000 area. The color scale stands for the water depths in meters.
This allows to reproduce ocean eddies with minimum diameters of about 40 km and to predict their internal structures and trajectories for the coming week. The formation and life cycle of even smaller eddies with minimum diameters of 10 km is made possible by another ROMS model with 1 km resolution (R1000), which in turn is nested in R4000. And finally, R0200 was incorporated into R1000 to reveal structures in the kilometer range. A special feature of the R0200 model area is its relocatability. This means that any subarea in R1000 can be investigated with the highest resolution of 200 m.
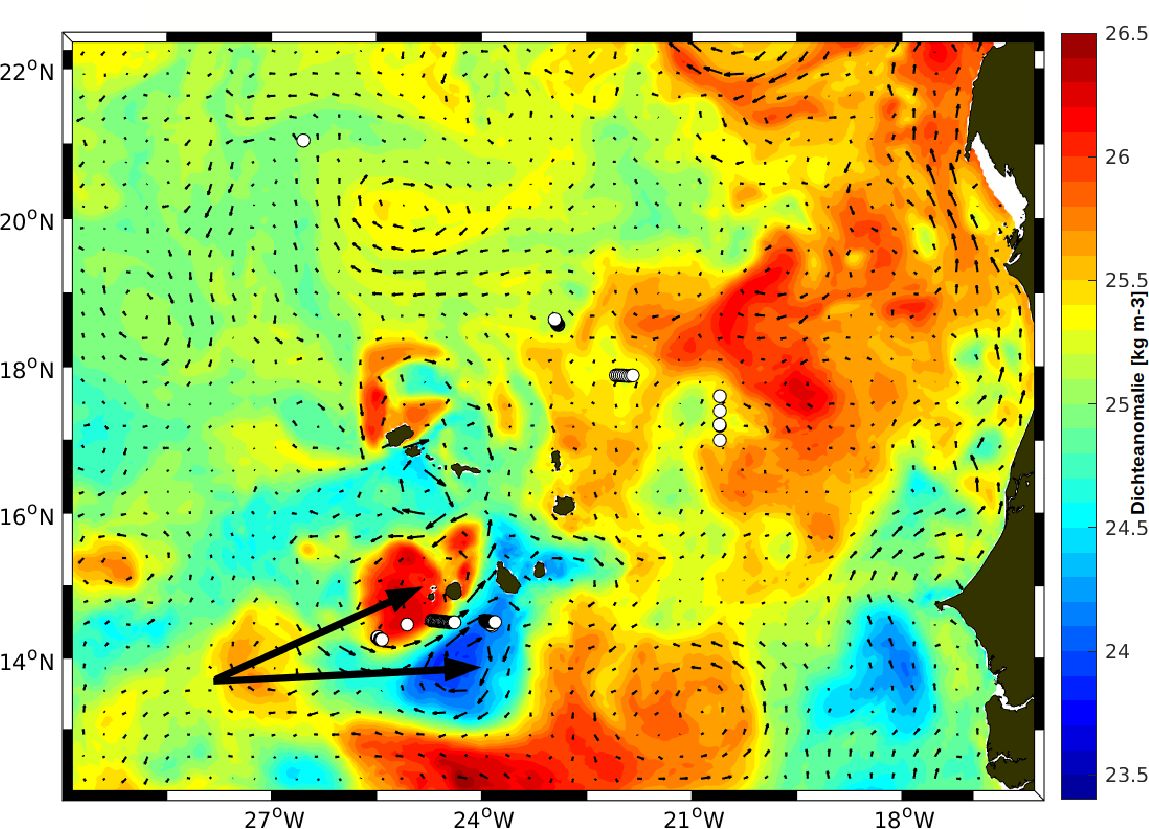
In order to improve the agreement between model predictions and the real conditions, observational data are included in the model by data assimilation. As an example for a R4000 result, Fig. 2 shows the density anomaly and horizontal currents in 50 m depth. The pair of eddies southwest of the Fogo island, marked by the large black arrows, is striking.

Fig. 2: Density anomaly and horizontal currents at 50 m depth on November 29 at noon in model area R4000. The positions of assimilated data are marked with white circles.
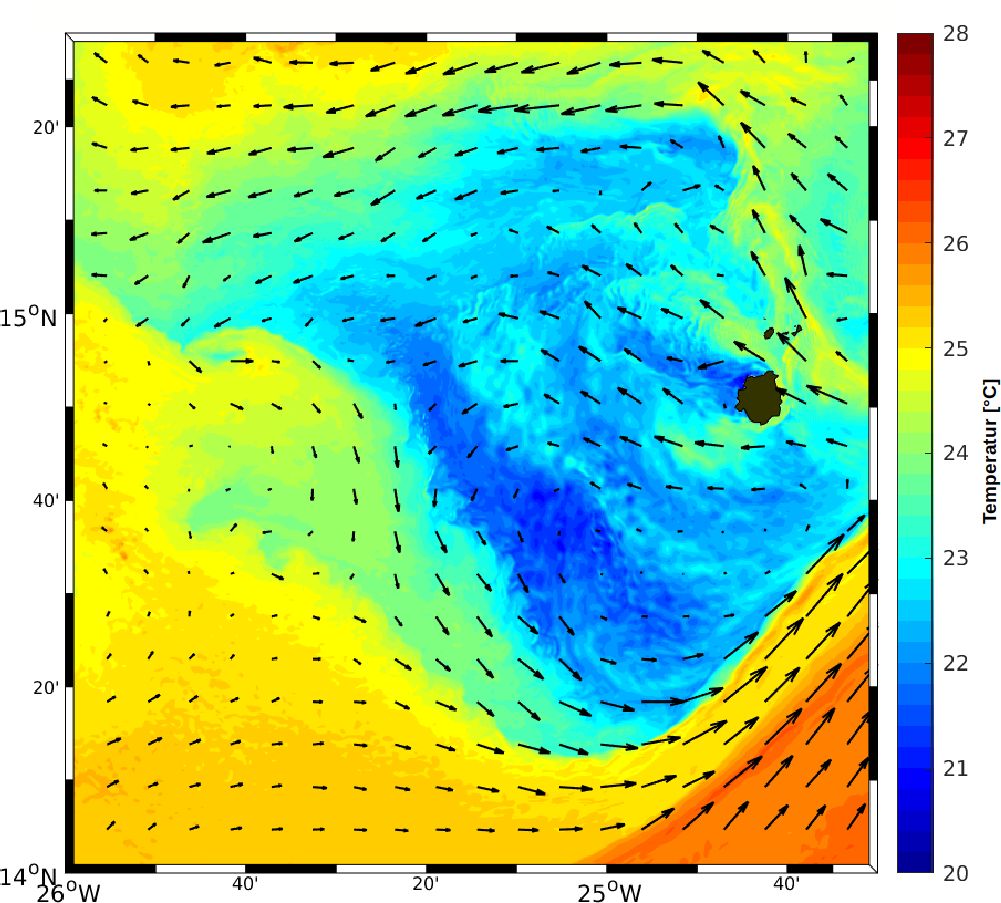
R0200 was shifted to the corresponding area with the aim to better resolve the structures in the northern eddy and a 48-hour forecast was made, starting at 0:00 h on November 29. Fig. 3 shows the calculations for 30 November at 6:00 h. Clearly visible are the anticlockwise rotation of the eddy, the low temperatures in the core and the meanders at the western edge of the eddy.

Fig. 3: Surface temperature and horizontal currents on November 30 at 6:00 h in model R0200 (horizontal resolution 200m).
For the period June until December 2019 results of ROMS simulations are presented here.
Contact: Reiner Onken (HZG)

