Sensor and Analysis

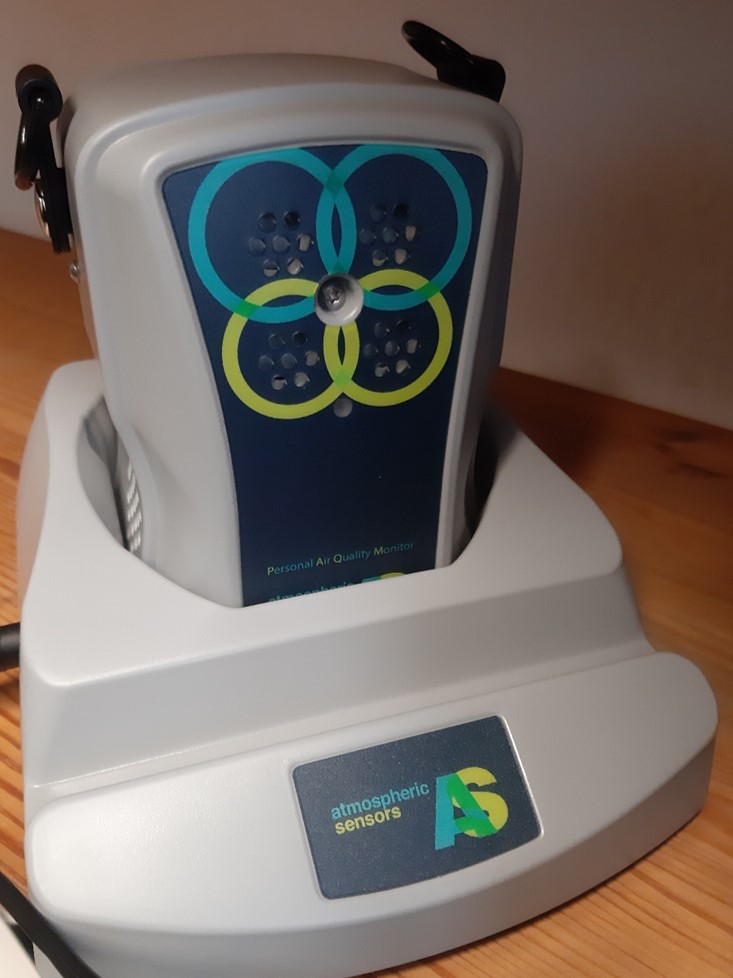
The PAM (Personal Air Quality Monitor) from Atmospheric Sensors is being used for our 2021 and 2023 measurement campaign. This measures fine dust particles (PM1, PM 2.5, PM 10), gas concentrations (NO2, NO, CO, O3), noise levels, temperature and humidity. The GPS position of the measurement and acceleration values are also saved. At the end of a measurement day, the sensor is placed in the charging station. The collected data is then sent to UFZ server.
Analysis
Step 1: Calibration of the Initial PAM Sensors
For the calibration of gaseous pollutants like NO2, CO, NO, and O3, the readings from the reference sensors were used as the baseline. A linear regression model was applied, which is a statistical method used to establish a relationship between two variables by fitting a linear equation to the observed data. In this case, the reference sensor readings were the independent variable (predictor), while the PAM sensor readings were the dependent variable (response). The linear regression analysis produced a coefficient (slope) and an intercept, which together formed a calibration equation (given below)
y = α + βx
Step 2: Calibration of All 12 Sensors
The second step extended the calibration process to include all 12 sensors used in the study. For this phase, all sensors were placed in a controlled environment within a room at the UFZ for two days. During this phase, the average readings from the five PAM sensors, which had already been calibrated in Step 1, were used as the true values. These true values served as the baseline for calibrating the remaining seven sensors. Similar to the first step, a linear regression was performed, using the average calibrated readings from the five PAM sensors as the independent variable and the readings from the remaining sensors as the dependent variable. Once these new calibration equations were established, they were applied to the entire dataset for the remaining seven sensors throughout the measurement campaign.


