Global scientific synthesis
Decisions on land use and land management planning are made on the ground, in the field, in specific regions. Global changes, such as the climate change, technologies, trade, and consumption patterns are determined by global processes. The complex interactions together with the regional spatial heterogeneity of landscapes make sustainable land management a big challenge. Assessing the relevance of individual results from regional projects and exploring their transferability to larger scales is one of the main tasks of the “global scientific synthesis” of the GLUES project. The global scientific synthesis was based on:
development and provision of consistent global-scale scenarios on land use
provision of scientific geodata infrastructures to support exchange and communication of data and results
analysis and characterisation of global land systems as a socio-environmental system with respect to ecosystem services, biodiversity, etc.
results communication to international policy bodies (science-policy interface)
support of stakeholder collaboration
These activities made it possible to study the relationships between land use, ecosystem services, and biodiversity, to support the global findings with lessons learned from the regional projects, and to understand the transferability of regional solutions to other places around the world.
Key findings
Understanding global archetypical patterns of land systems is necessary to assess the impacts of land-use changes on the environment and help provide appropriate countermeasures. These archetypes can be identified based on indicators of land-use intensity, climate, environmental, and socio-economic conditions (Vaclavik et al 2013). [press release]
Climate change poses a major challenge to agriculture. However, some regions may benefit from it as well. For example, changing climate may increase the area of cropland available in the high latitudes of the northern hemisphere (Canada, Russia, China) over the next 100 years. In contrast, losses of potentially suitable agricultural land are expected in Mediterranean regions and Sub-Saharan Africa (Zabel et al 2014). [press release]
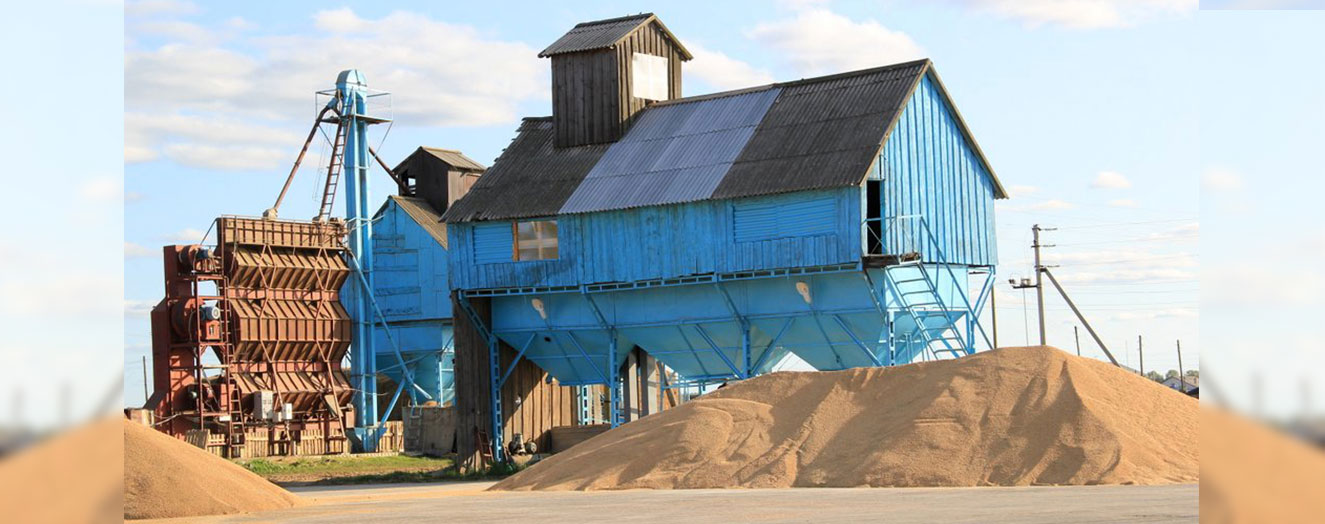
The rising demand for food can be met without expansion of agricultural cropland if the land now available is optimally exploited. The stock of agricultural land currently in use has the potential to feed the growing population and even to exceed the projected demand for the year 2050. But to do so, harvests, storage, transport, throw-away mentality, etc. need to be optimized (Mauser et al 2015). [press release]
Recommendations
If agricultural expansion continues in the future, it will likely occur in conservation areas. These potential conflict regions require more detailed assessments. Only this way the results of different food security strategies can be understood and mechanisms for the protection of habitats with high biodiversity can be developed (Delzeit et al. 2017).
Assessments of agricultural intensification focusing on yields alone overlook numerous drivers of biodiversity loss (e.g. salinization of soils, toxic run-off). A broader spectrum of land-use intensity indicators needs to be considered when balancing agricultural production and biodiversity (Gerstner et al. 2014, Kehoe et al. 2015).
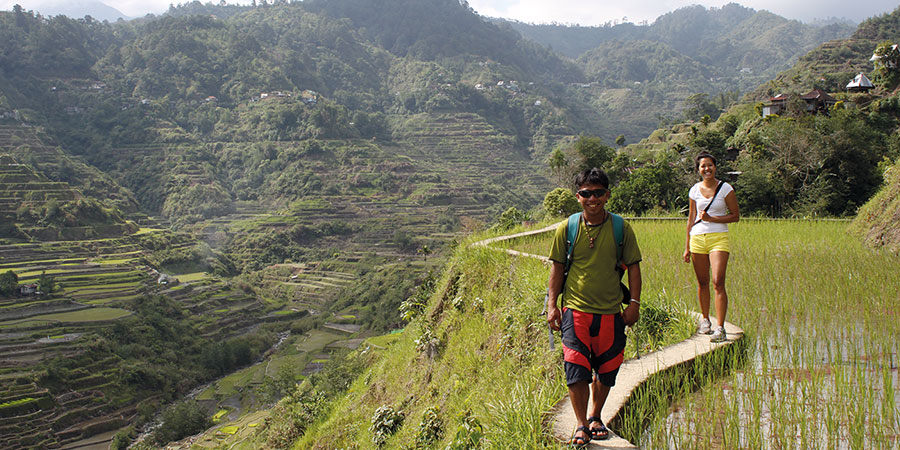
Many land-based research projects are specific to a small region. The local land systems and their similarities with other places around the world should be assessed to identify regions that face similar land-use challenges. This will help translate the existing local knowledge and solutions to land management issues into many locations (Vaclavik et al. 2016). [press release]
Monetary valuation is a promising scientific tool for providing explicit values for non-market ecosystem services, implemented through Payments for Ecosystem Services (PES) schemes. These assessments should distinguish between sources of uncertainties and quantify the influence of site characteristics that affect value transfer functions and predicted ES values (Schmidt et al. 2016).
Illustrated examples
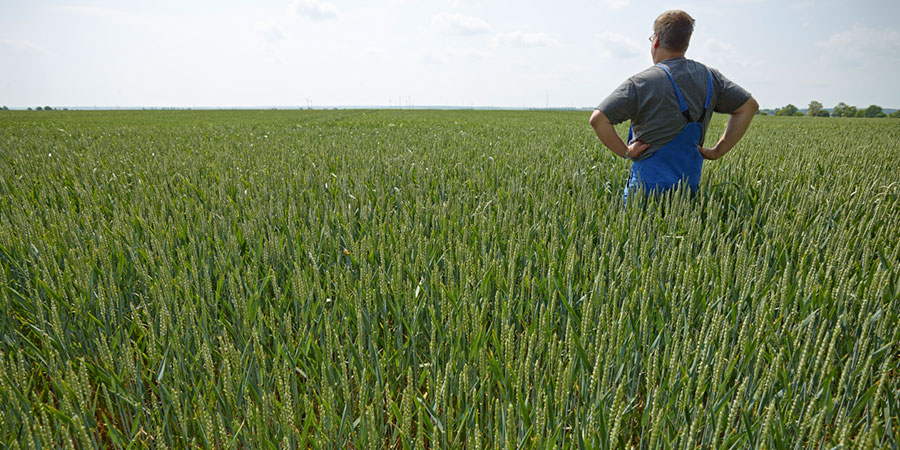
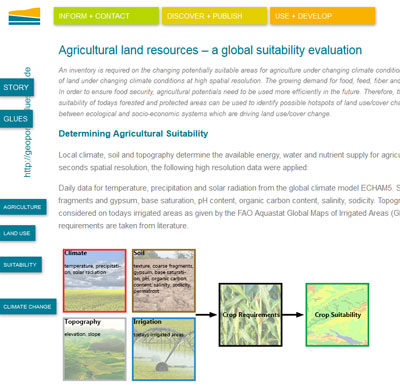
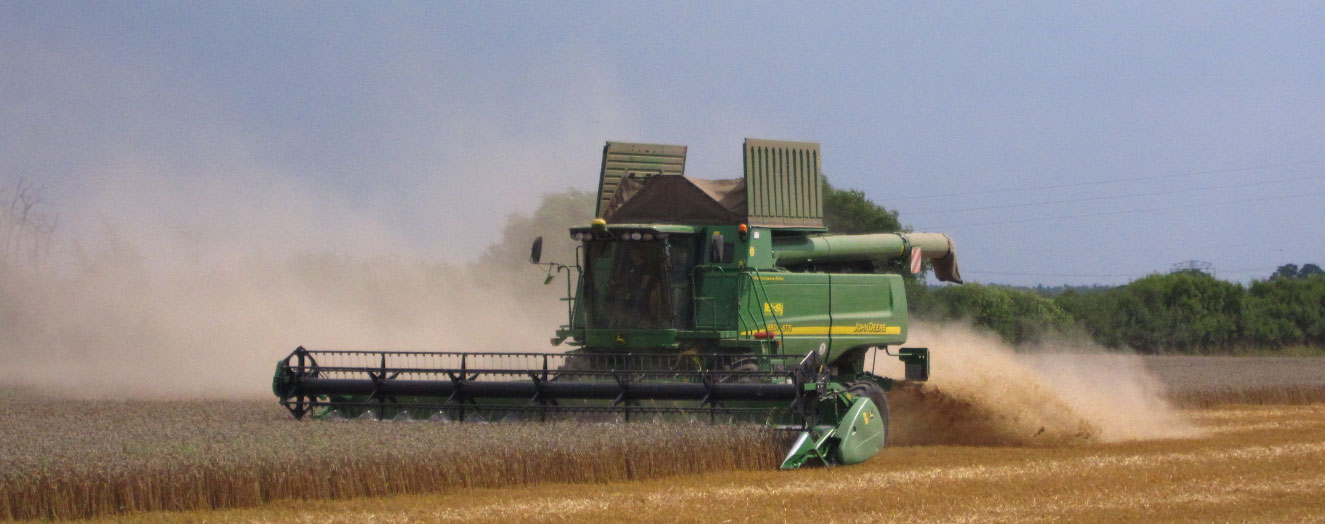
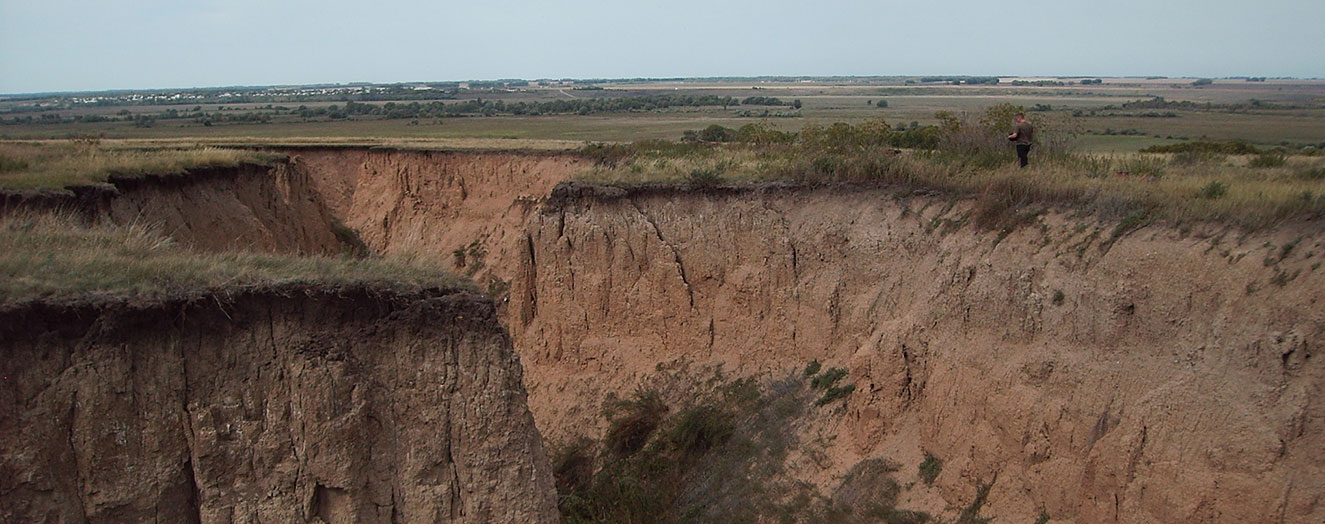
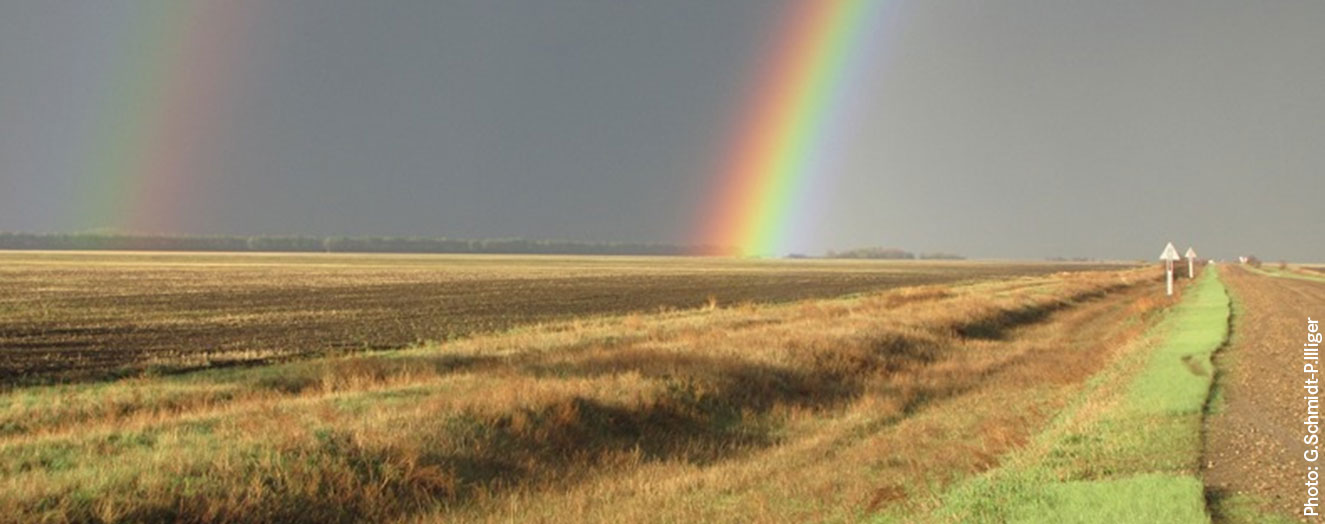
Agricultural Land Resources
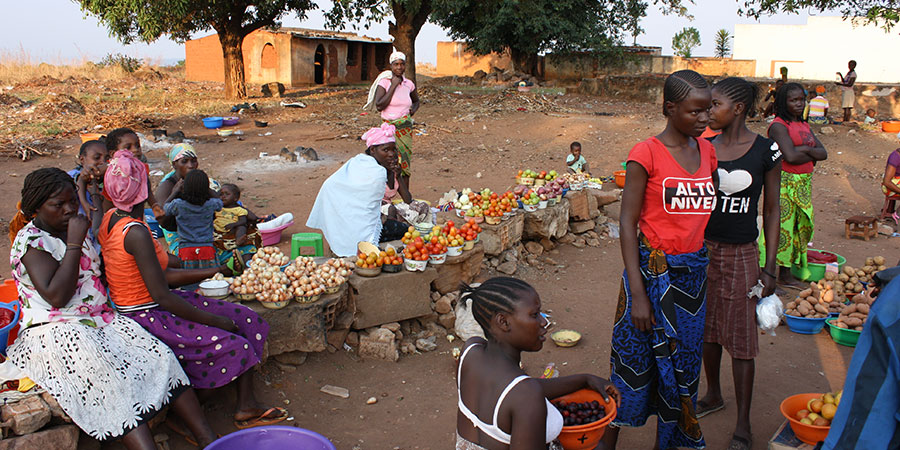
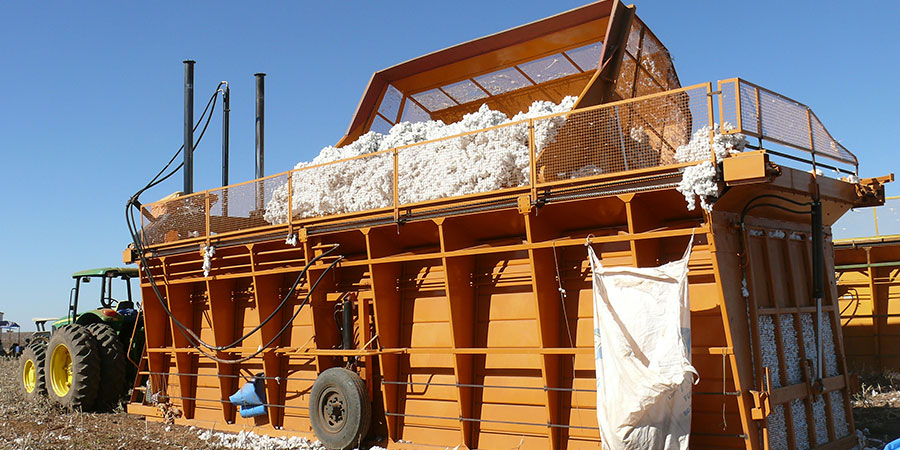
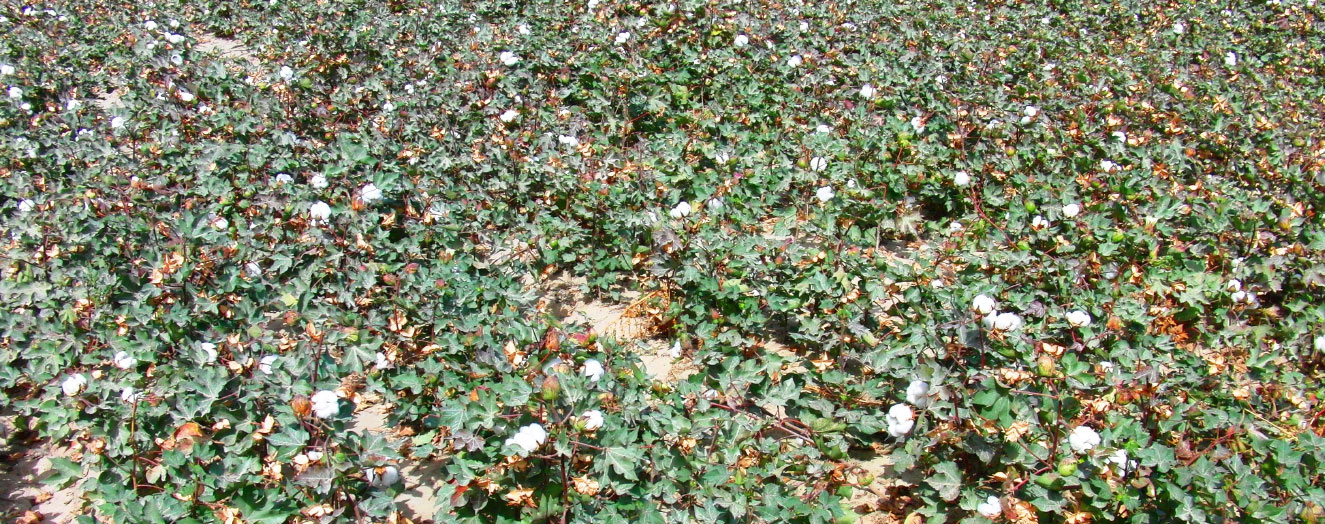
The growing demand for food, feed, fibre and bioenergy increases pressure on land and brings land use/land cover changes and trade-offs between different uses of land and ecosystem services. In order to ensure food security, agricultural potentials need to be used more efficiently in the future.
It is therefore of great importance to understand global agricultural potentials and the interdependences of effects between ecological and socio-economic systems that cause the land use/land cover change.
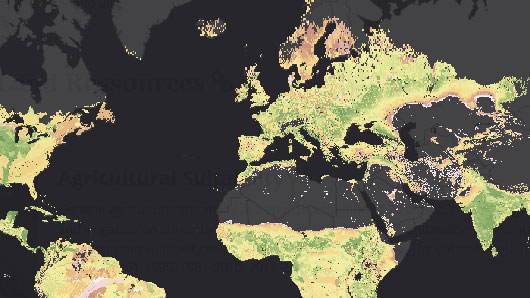
General agricultural suitability at a spatial resolution of 30 arcsec, considering rainfed conditions and irrigation on currently irrigated areas. The agricultural suitability represents for each pixel the maximum suitability value of the considered 16 crops (e.g. maize, oil palm, soybean).
Most of the Earth’s agricultural land resources are already under cultivation. Climate change poses a huge challenge to global agriculture, but it is uncertain which regions may be affected the most or whether some regions may even benefit from it. Therefore, an inventory is required of the potentially suitable areas for agriculture under changing climate conditions.
The modeling results of the GLUES team indicate that climate change will expand the supply of cropland in the high latitudes of the Northern hemisphere (Canada, Russia, China) over the next 100 years. However, in the absence of adaptation measures such as increased irrigation, the simulation projects a significant loss of suitable agricultural land in Mediterranean regions and in parts of Sub-Saharan Africa.
The global map shows general agricultural suitability (low to high) for four time periods (1961-1990, 1981-2010, 2011-2040, 2071-2100) at a spatial resolution of approximately 1 km. The agricultural suitability considers rainfed conditions and irrigation on currently irrigated areas. Each pixel in the map represents the maximum suitability value of the considered 16 major crops.
How to use this map: In the upper left corner, select the Layers button. Using a checkbox, select the GLUES agricultural suitability and click the arrow to open the map menu. Consequently, you can adjust the map view by selecting desired map layers under the Sublayers tab and set their opacity in the Opacity tab. The map legend with respective legend items is available under the Legend tab. The four available sublayers will provide information about the general agricultural suitability for four 30-year time periods.
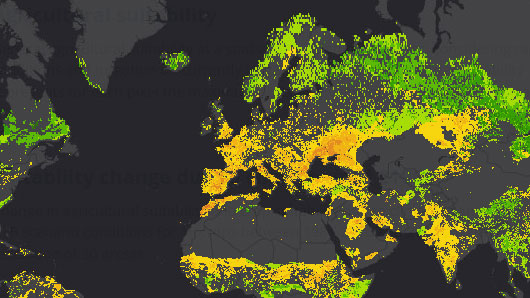
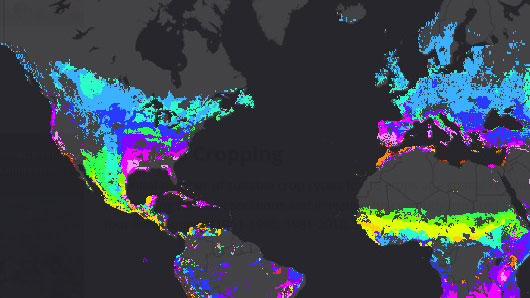
Change in agricultural suitability and crop suitability due to climate change. Based on scenario calculations, this map reveals global suitability for 16 crops between 1981-2010 and 2071-2100.
Most of the Earth’s agricultural land resources are already under cultivation. Climate change poses a huge challenge to global agriculture, but it is uncertain which regions may be affected the most or whether some regions may even benefit from it. Therefore, an inventory is required of the potentially suitable areas for agriculture under changing climate conditions.
The modeling results of the GLUES team indicate that climate change will expand the supply of cropland in the high latitudes of the Northern hemisphere (Canada, Russia, China) over the next 100 years. However, in the absence of adaptation measures such as increased irrigation, the simulation projects a significant loss of suitable agricultural land in Mediterranean regions and in parts of Sub-Saharan Africa.
This map shows change in agricultural suitability for 16 major agricultural crops between 1981‒2010 and 2071‒2100. The colors represent change in (both overall and crop-specific) agricultural suitability due to climate change according to the SRES A1B scenario (green areas indicate an increase in suitability, brown areas show a decreasing suitability). While new cropland is predicted to become available in the Northern hemisphere (green), conditions are expected to deteriorate in other areas, including the Mediterranean region (brown).
How to use this map: In the upper left corner, select the Layers button. Using a checkbox, select the GLUES suitability change due to climate until 2100 and click the arrow to open the map menu. Consequently, you can adjust the map view by selecting desired map layers under the Sublayers tab and set their opacity in the Opacity tab. The map legend with respective legend items is available under the Legend tab. The first available sublayer shows the overall global agricultural suitability change (for all crops combined), whereas the following sublayers provide information about crop-specific agricultural suitability change (e.g. for barley, cassava, maize, etc.).
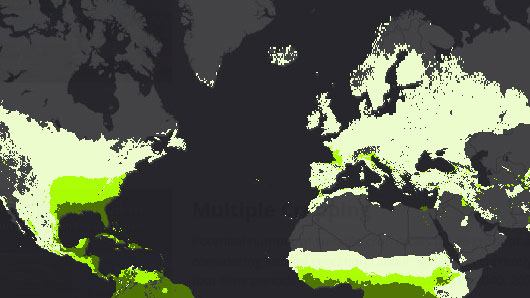
Potential number of suitable crop cycles for 16 crops, considering rainfed conditions and irrigation on currently irrigated areas. The dataset contains four time periods (1961-1990, 1981-2010, 2011-2040, 2071-2100).
Most of the Earth’s agricultural land resources are already under cultivation. Climate change poses a huge challenge to global agriculture, but it is uncertain which regions may be affected the most or whether some regions may even benefit from it. Therefore, an inventory is required of the potentially suitable areas for agriculture under changing climate conditions.
The modeling results of the GLUES team indicate that climate change will expand the supply of cropland in the high latitudes of the Northern hemisphere (Canada, Russia, China) over the next 100 years. However, in the absence of adaptation measures such as increased irrigation, the simulation projects a significant loss of suitable agricultural land in Mediterranean regions and in parts of Sub-Saharan Africa.
Climate change is likely to have an effect on the potential of an agricultural land to have multiple crop cycles per year. These maps show the potential number of suitable crop cycles (single/double/triple) for 16 crops (combined and individually) considering rainfed conditions and irrigated areas. The maps cover four time periods (1961-1990, 1981-2010, 2011-2040, 2071-2100).
How to use this map: In the upper left corner, select the Layers button. Using a checkbox, select the GLUES multiple cropping and click the arrow to open the map menu. Consequently, you can adjust the map view by selecting desired map layers under the Sublayers tab and set their opacity in the Opacity tab. The map legend with respective legend items is available under the Legend tab. By selecting the appropriate sublayers for each one of the four 30-year time periods, you can display the potential number of suitable crop cycles (one to three) for all plants combined together, as well as for particular crops (e.g. barley, cassava, maize, etc.)
Start of the growing cycle for 16 crops at a spatial resolution of 30 arcsec, considering rainfed conditions and irrigation on currently irrigated areas. In case of multiple cropping, the start of the first growing cycle is shown. The dataset contains four time periods (1961-1990, 1981-2010, 2011-2040, 2071-2100).
Most of the Earth’s agricultural land resources are already under cultivation. Climate change poses a huge challenge to global agriculture, but it is uncertain which regions may be affected the most or whether some regions may even benefit from it. Therefore, an inventory is required of the potentially suitable areas for agriculture under changing climate conditions.
The modeling results of the GLUES team indicate that climate change will expand the supply of cropland in the high latitudes of the Northern hemisphere (Canada, Russia, China) over the next 100 years. However, in the absence of adaptation measures such as increased irrigation, the simulation projects a significant loss of suitable agricultural land in Mediterranean regions and in parts of Sub-Saharan Africa.
Climate change affects the plant phenological cycles and the length of a growing season. These maps show the estimated start of the growing cycle (weeks 1‒52, pink to dark red) for 16 crops considering rainfed conditions and irrigated areas. In case of multiple cropping, the start of the first growing cycle is shown. The maps cover four time periods (1961-1990, 1981-2010, 2011-2040, 2071-2100).
How to use this map: In the upper left corner, select the Layers button. Using a checkbox, select the GLUES growing cycle and click the arrow to open the map menu. Consequently, you can adjust the map view by selecting desired map layers under the Sublayers tab and set their opacity in the Opacity tab. The map legend with respective legend items is available under the Legend tab. By selecting the appropriate sublayers for each one of the four 30-year time periods, you can display the estimated start of the growing cycle (week 1-52) for 16 agricultural crops (e.g. barley, cassava, maize, etc.).
Archetypes
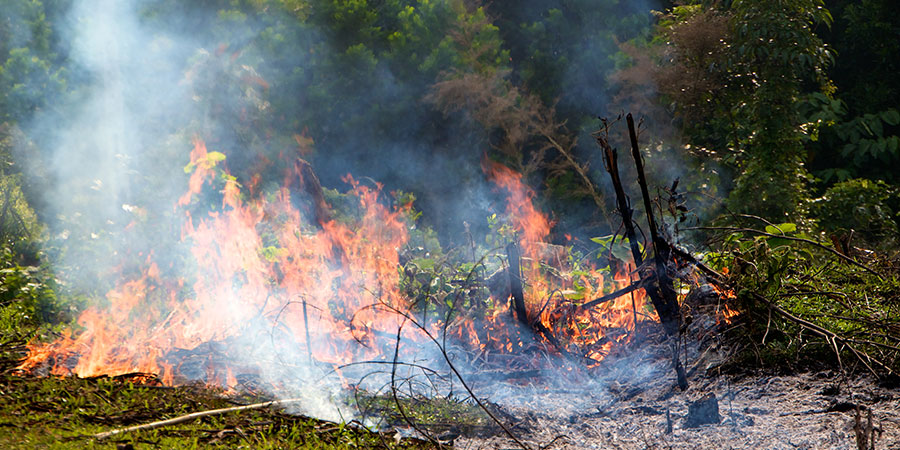
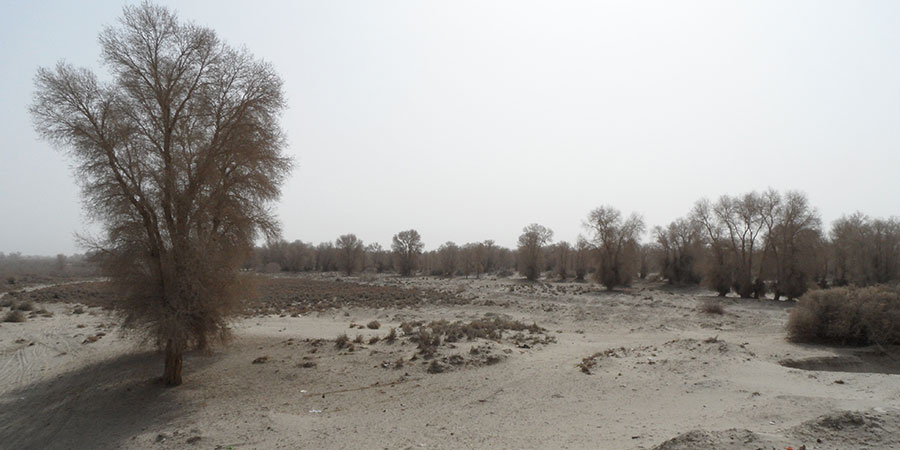
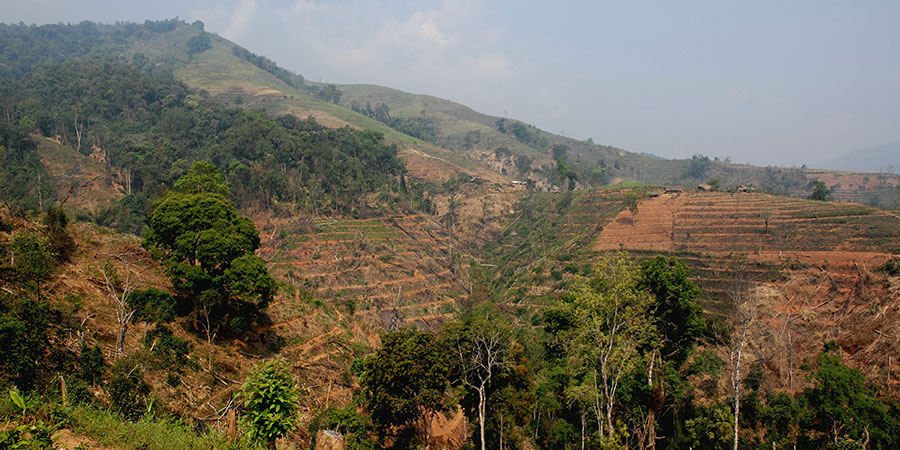
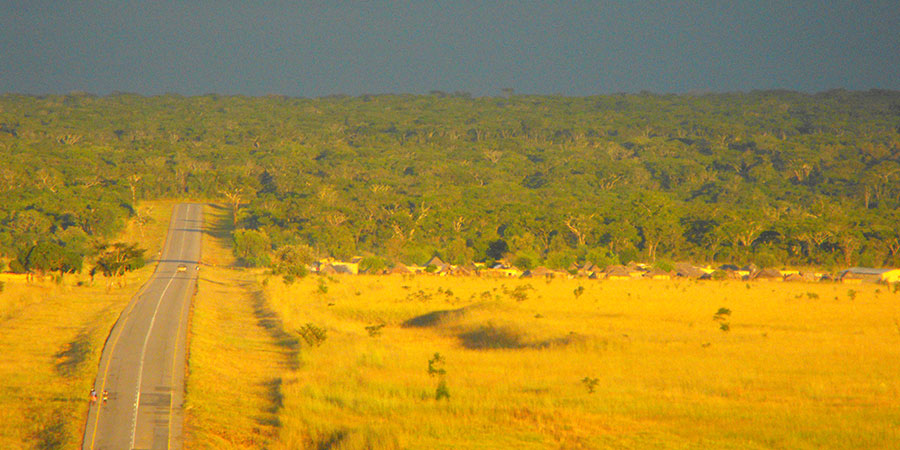
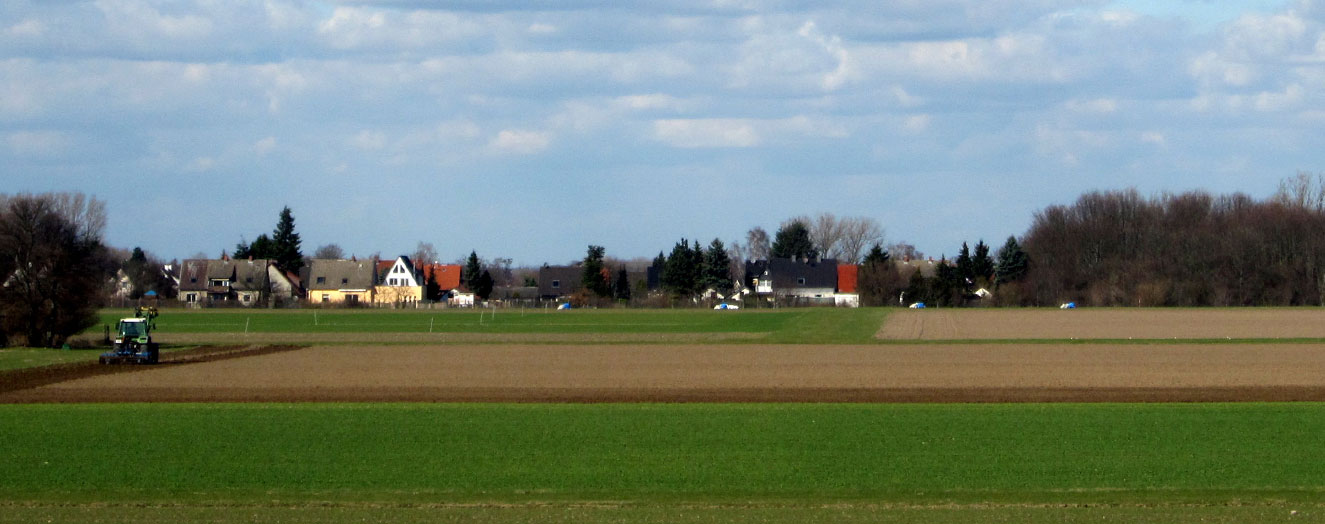
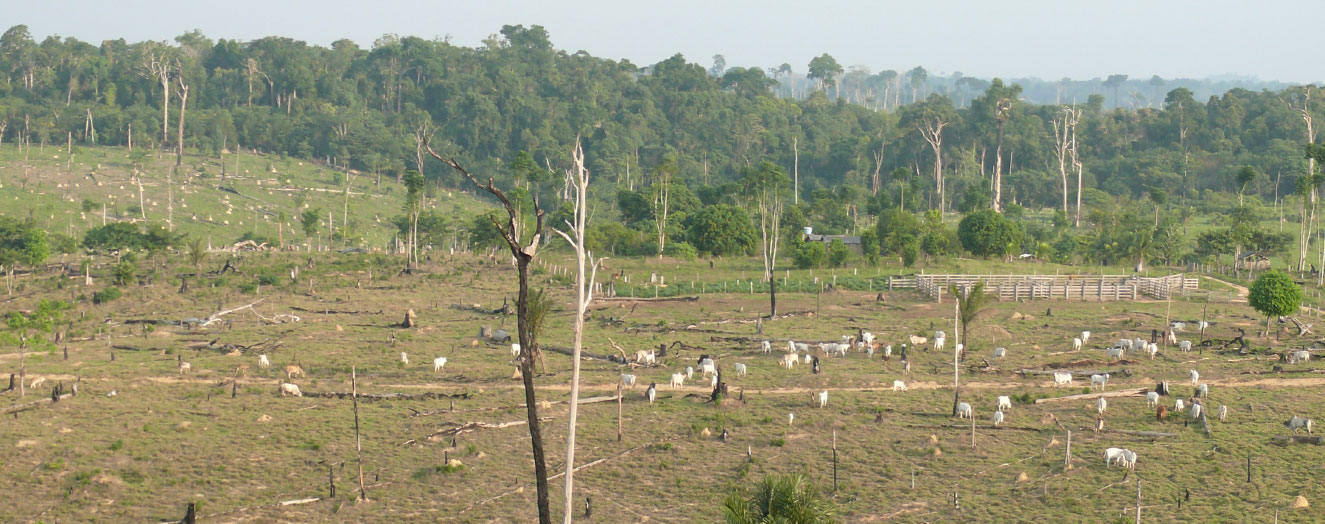
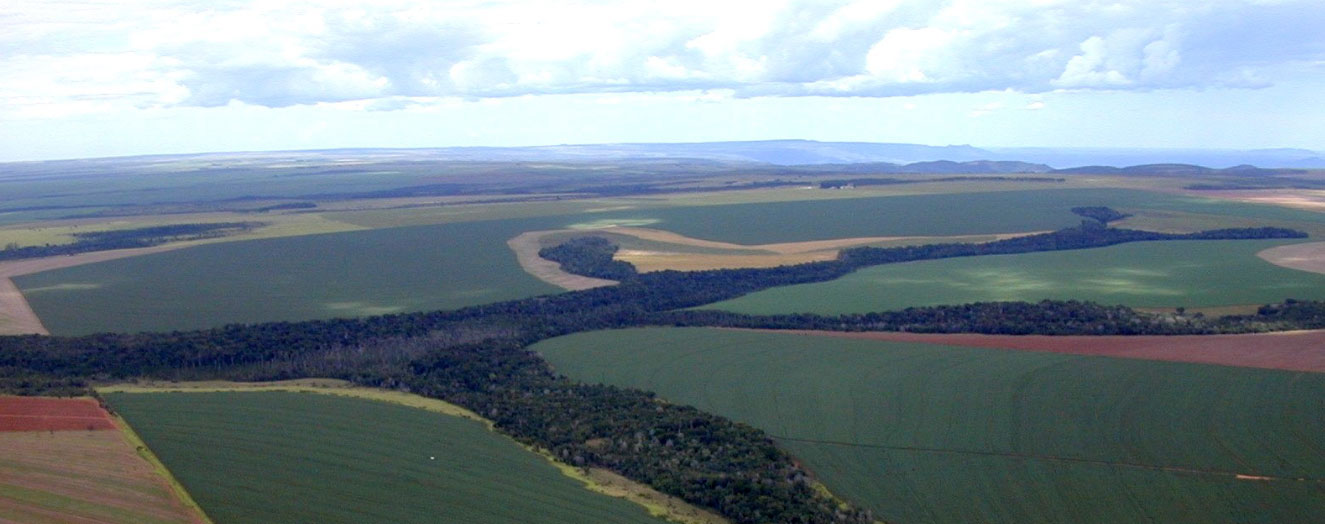
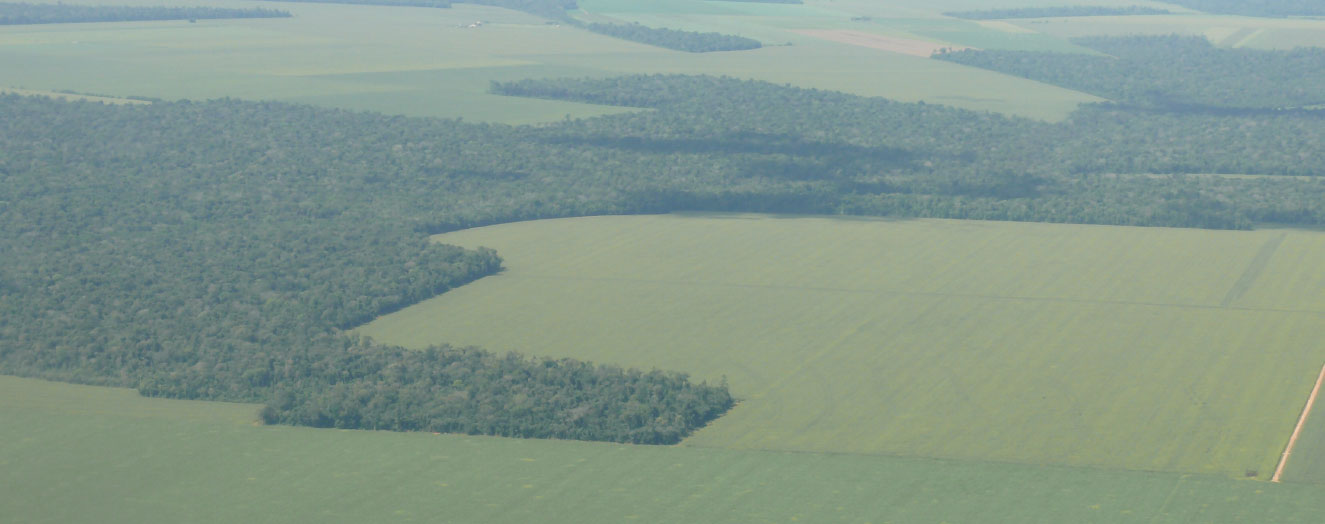
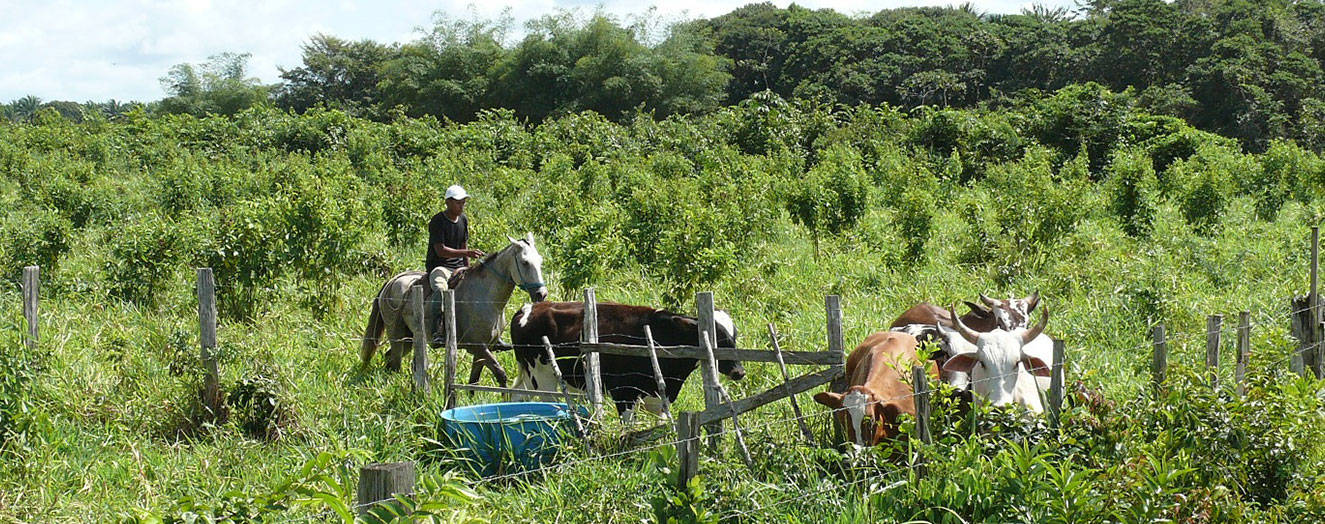
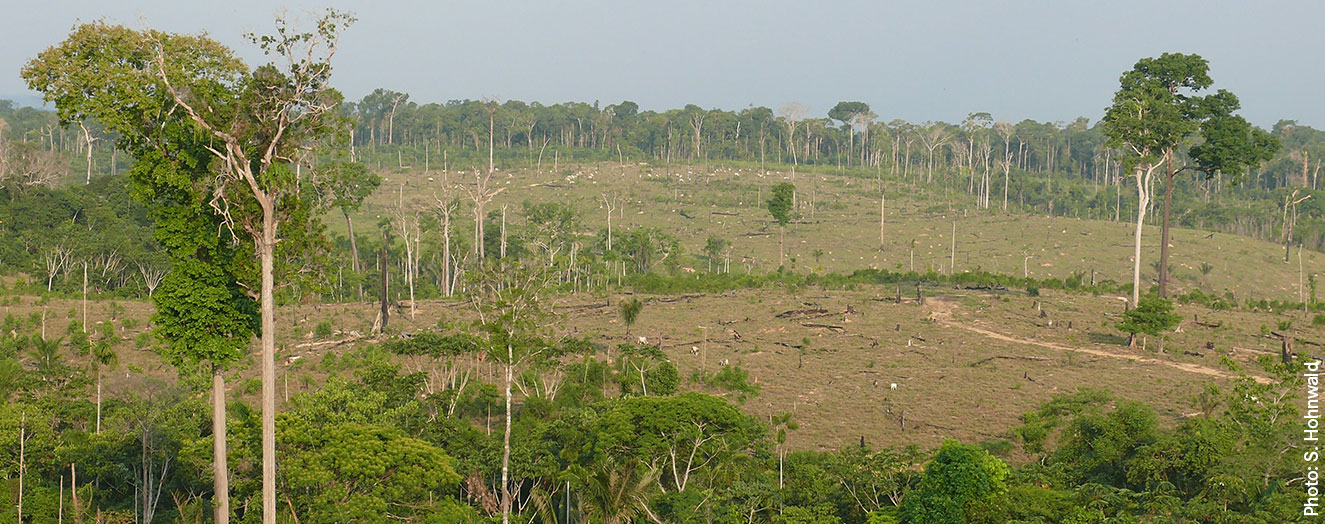
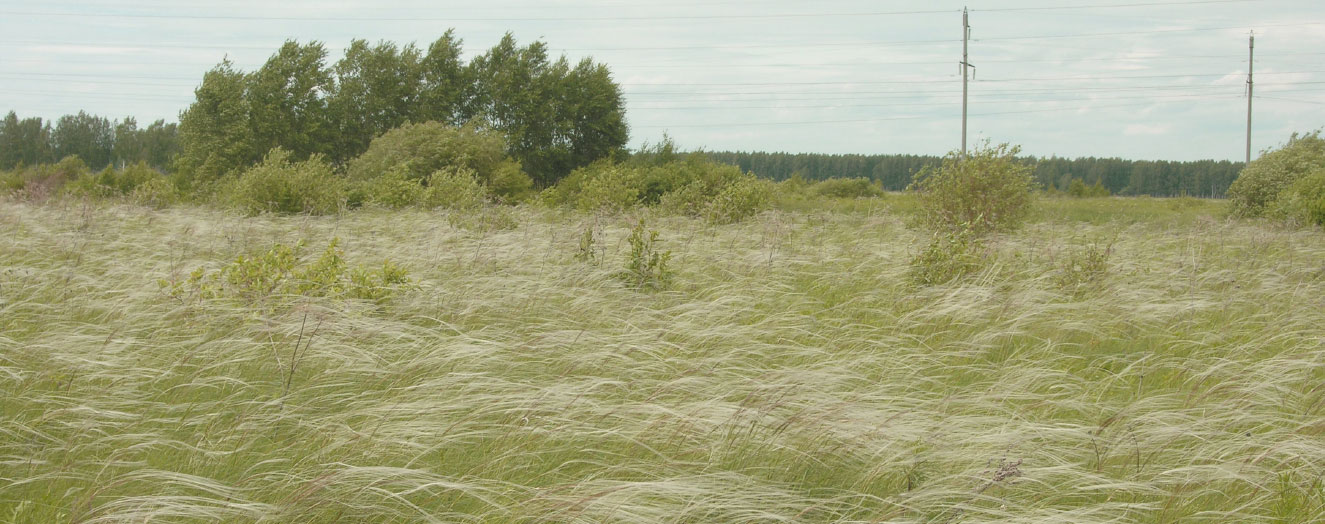
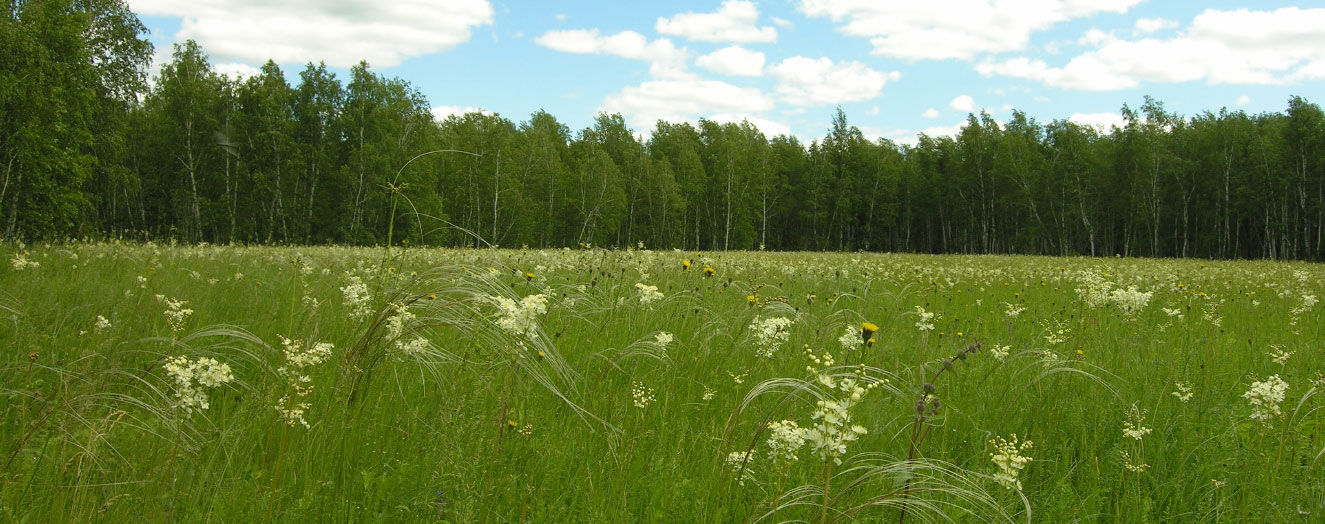
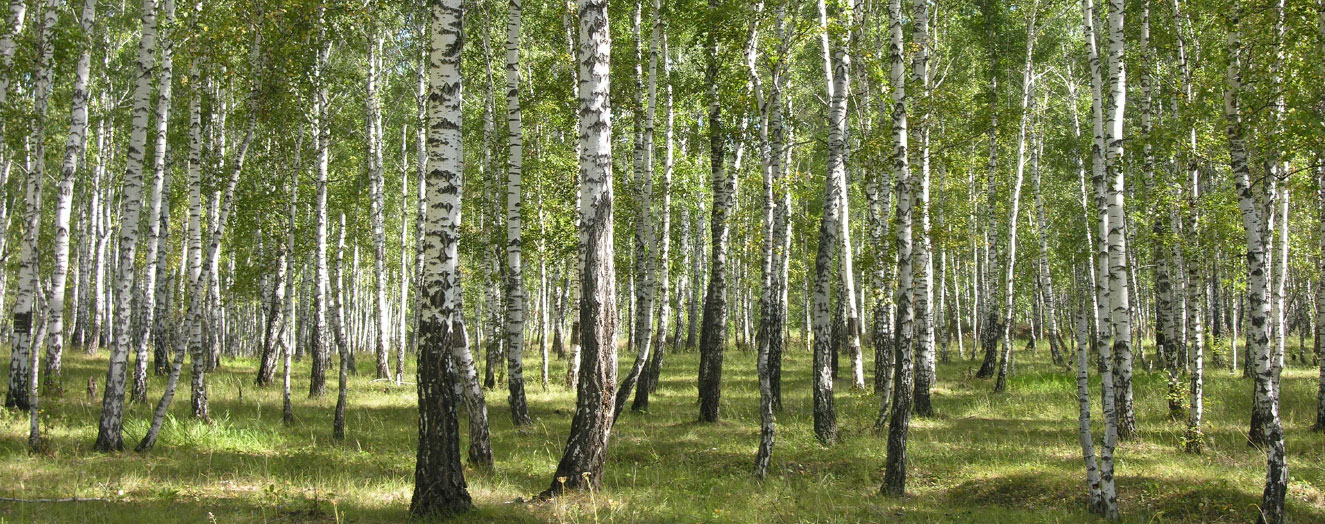
Land use changes come in various forms: meadows and grasslands are replaced by maize fields, tropical forests are cleared and used as pastures, steppes become cropland. The reasons are complex, the impacts are immense: animal and plant communities change, ecosystem functions disappear, carbon emissions contribute to climate change. Whatever happens regionally has global consequences.
In order to assess the global impacts of land use on the environment and help provide appropriate countermeasures, the GLUES research group has created a new world map of land use systems. Based on various indicators of land-use intensity, climate, environmental and socio-economic conditions, they identified twelve global patterns called land system archetypes.
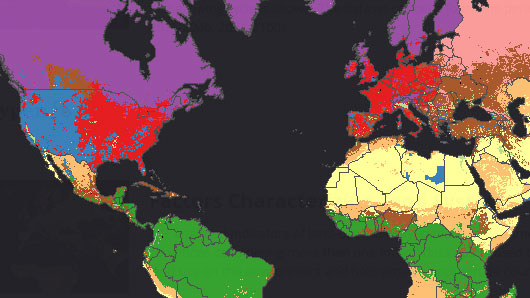
Global land system archetypes: world map and regional areas revealing a clustered pattern of human–environment interactions and land-use intensity. Each archetype is characterized by a specific combination of 30+ land management indicators.
The world map shows twelve land system archetypes and thirty two environmental, socioeconomic, and land-use intensity factors that were used for the classification of archetypes. The map reveals a clustered pattern of human–environment interactions and land-use intensity.
Global land system archetypes: world map and regional areas revealing a clustered pattern of human-environment interactions and land-use intensity. Each archetype is characterized by a specific combination of 32 indicators of land management, climate, environmental and socio-economic conditions. There are similarities in land systems across the globe but the diverse pattern at sub-national scales implies that there are no ‘one-size-fits-all’ solutions to sustainable land management.
These patterns show a different picture of land use than scientists had before. China for example was quite similar to the situation in Western Europe or the United States. Thus, parts of the country, together with regions of India and, of course, large areas of Europe, were assigned to the ‘intensive cropping systems’ archetype”.
This representation of land systems is useful because it can provide science-based policy recommendations for regions in certain land-use types on how to avoid negative consequences of land use. This can be easily explained with examples from Latin America and Southeast Asia: many areas in these regions are classified as ‘degraded forest/cropland systems in the tropics’ characterized by extremely high soil erosion. Because the socio-economic data show that agriculture plays an important role in the national economy of the local countries, it is essential to develop and apply erosion control measures for these regions. Only then the agricultural yields could increase without negatively affecting the environment. In other land systems the situation is quite different. The extensive cropping systems of Eastern Europe or India still have a high potential to increase the agricultural yields. Such opportunities, however, are largely exhausted in the intensive cropping systems of Western Europe and the USA.
Land system archetypes help us better understand the interactions between human activities on the one hand and social and environmental changes on the other.
Factors characterizing land systems
Global patterns of land system archetypes were identified based on 32 indicators characterizing land-use intensity, environmental factors and socioeconomic factors. We hypothesized these variables would well represent the multidimensional aspects of human–environment interactions, while many of these factors function both as drivers and consequences in the complex land systems. The land-use intensity indicators covered input indicators, such as the area of cropland and the intensity of irrigation or nitrogen fertilization, as well as output indicators, such the yields for major agricultural crops or the amount of net primary production appropriated by humans (HANPP). The environmental indicators included climate and other biophysical constraints, such as the annual and seasonal primary production or soil organic carbon. As socioeconomic indicators, the FAO indices were used, such as GDP or the proportion of GDP originating from agriculture, human population estimates but also several world governance indicators, such as political stability or accessibility to major cities and market places.
Publication: Václavík, T., Lautenbacha, S. Kuemmerle, T., Seppelt, R. 2013. Mapping global land system archetypes. Global Environmental Change (2013). 23 (6) pp. 1637–1647.
doi.org/10.1016/j.gloenvcha.2013.09.004
www.sciencedirect.com/science/article/pii/S0959378013001532
Press release: www.ufz.de/index.php?en=35349
How to use this map: In the upper left corner, select the Layers button. Using a checkbox, select the GLUES growing cycle and click the arrow to open the map menu. Consequently, you can adjust the map view by selecting desired map layers under the Sublayers tab and set their opacity in the Opacity tab. The map legend with respective legend items is available under the Legend tab.
Uncertainty of monetary valuation of ecosystem services
Growing demand for resources increases the pressure on ecosystem services (ES) and biodiversity. Monetary valuation of ES is frequently seen as a decision-support tool, as it provides explicit values for unconsidered goods and services. Valuation methods, such as benefit transfer, are an attractive option for researchers and policy-makers who face resource constraints.
The team of GLUES researchers developed global benefit transfer models for twelve ES and assessed uncertainties that need to be taken into account. This analysis represents the starting point for establishing a standardized integration of and reporting on uncertainties for a reliable and valid benefit transfer as an important component for decision support.
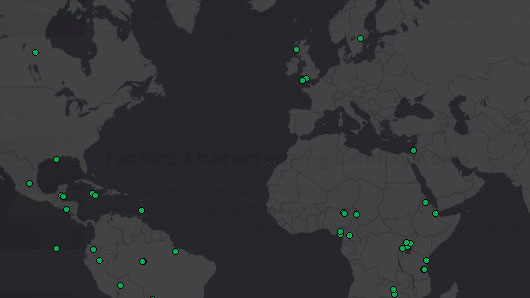
The knowledge on feasible monetary valuation of ecosystem services is spatially distributed. A synthesis of case studies shows extrapolated relative monetary values (yellow to green) and uncertainties (yellow to red) of the benefit transfer functions for the ecosystem services. The monetary values and uncertainties are grouped into different classes from low to high.
The points show locations of case studies used to calculate the monetary values of individual ES. The bivariate maps show extrapolated relative monetary values (yellow to green) and uncertainties (yellow to red) of the benefit transfer functions for the ES. : A ) food provision, B) water provision, C) climate regulation, D) extreme event regulation, E) recreation service and F) habitat service, G) raw material provision, H) provision of medicinal resources, I) waste treatment, J) erosion regulation, K) soil fertility regulation and L) maintenance of genetic diversity. Monetary values and uncertainties are grouped into different classes from low to high (in the legend the first number represents uncertainty and the second monetary values, e.g. 11= both low, 12= uncertainty low and monetary value medium, 32= uncertainty high and monetary value medium etc.). The classes were defined by equal interval distances for each ES separately.
Major sources of uncertainties include errors resulting from the input data for the benefit transfer model, the model characteristics and the transfer error due to generalization. The latter, for instance, arises when values are transferred to other areas under the assumption that particular socio-environmental conditions, spatial or temporal scale are constant. For the ES food provisioning it is often assumed that agricultural productivity is the same for all croplands, regardless natural composition and anthropogenic management. These results show that although socio-economic indicators are often discussed for benefit transfer applications, the consideration of biophysical heterogeneity in ecosystems is most important.
How to use this map: In the upper left corner, select the Layers button. Using a checkbox, select the Uncertainties in Monetary Valuation and click the arrow to open the map menu. Consequently, you can adjust the map view by selecting desired map layers under the Sublayers tab and set their opacity in the Opacity tab. The map legend with respective legend items is available under the Legend tab. The first twelve available sublayers (A-L) show locations of case studies that were used to calculate the monetary values of individual ES. The following twelve sublayers show extrapolated relative monetary values (yellow to green; low to high, respectively) and uncertainties (yellow to red; low to high, respectively) of the benefit transfer functions for the ES. The uncertainty level indicates how much it is possible to trust the modeled results for the particular ES.
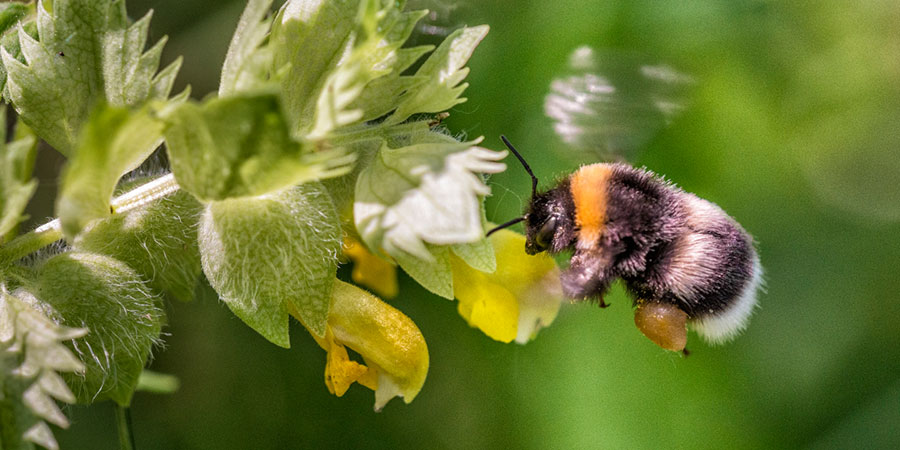
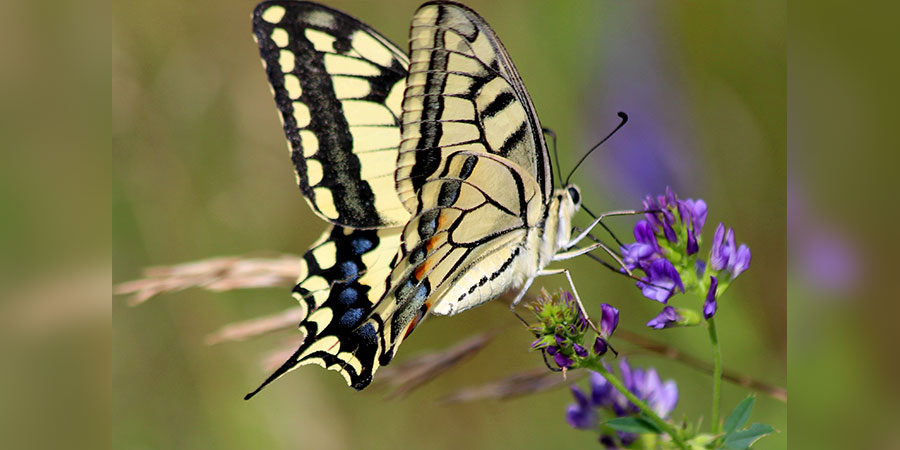
Pollination benefits
In recent years the economic value of pollination-dependent crops has substantially increased around the world. Researchers from the Helmholtz Centre for Environmental Research (UFZ), the Technical University of Dresden and the University of Freiburg found out in which regions pollination plays a particularly important role and where agriculture is even more dependent on animal pollinators.
The results of their spatial analysis provide important information for nature conservation practice and policy decisions, and enable development of region-specific recommendations for the protection of agricultural elements vital for the survival of insects.
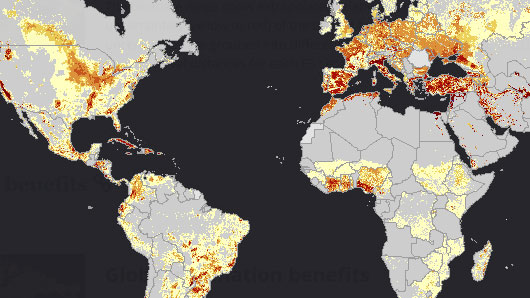
Pollination is one of the best studied ecosystem services, addressed also by the IPBES (Intergovernmental Science-Policy Platform on Biodiversity and Ecosystem Services) report. This world map shows the economic importance of pollination for agriculture based on yield data on pollination-dependent crops. The values are given as US $ per hectare for the year 2000 and were adjusted for the inflation rate (for the year 2009).
This world map shows the economic importance of pollination for agriculture based on yield data on pollination-dependent crops. The values are given as US $ per hectare for the year 2000 and were adjusted for the inflation rate (for the year 2009).
Particularly countries such as China, India, the USA, Brazil and Japan greatly benefit from pollination-dependent products. In the USA, for example, the dependence is particularly high in California but relatively unimportant in the corn belt of the Midwest. In Asia the northeast region of China is particularly dependent upon pollination, in Europe primarily the Mediterranean countries, such as Italy or Greece, and in Africa especially the region along the Nile in Egypt. For Germany, there were moderate dependencies found – nevertheless, in Germany and other parts of Europe as well pollination is in no way immaterial.
According to the calculations, a potential decline of pollination could particularly affect those countries in which pollination-dependent crops or cultures represent a substantial part of the gross domestic product from agriculture. This includes, for example, Argentina, Belgium, China, Ghana, Honduras, the Ivory Coast, and Jordan. The results also show that in countries such as Azerbaijan, Armenia, Cameroon or the Ukraine the relative dependence on agricultural products has increased significantly between 1993 and 2009. In countries such as Egypt, India, Jordan or Turkey, on the other hand, the relative dependence declined during the same period.
How to use this map: In the upper left corner, select the Layers button. Using a checkbox, select the Global pollination benefits and click the arrow to open the map menu. Consequently, you can adjust the map view by selecting desired map layers under the Sublayers tab and set their opacity in the Opacity tab. The map legend with respective legend items is available under the Legend tab. In the Sublayers menu, you can select 1) country borders, 2) total pollination benefits for all studied agricultural crops together, and 3) pollination benefits for individual agricultural crops, such as fruits (apples, apricots, citrus fruits, etc.), edible oil crops (cotton, soybeans, etc.), nuts (almonds, cashew nuts, etc.) and others. The values are given as US $ per hectare for the year 2000.
Further reading (selection)
Carter, S., Manceur, A.M., Seppelt, R., Hermans-Neumann, K., Herold, M., Verchot, L. (2017): Large scale land acquisitions and REDD+: A synthesis of conflicts and opportunities. Environmental Research Letters, 12(3): 35010.
URL: https://doi.org/10.1088/1748-9326/aa6056
Gerstner, K., Moreno-Mateos, D., Gurevitch, J., Beckmann, M., Kambach, S., Jones, H.P., Seppelt, R. (2017): Will your paper be used in a meta-analysis? Make the reach of your research broader and longer lasting. Edited by David Warton. Methods in Ecology and Evolution, 8(6): 777–84.
URL: https://doi.org/10.1111/2041-210X.12758
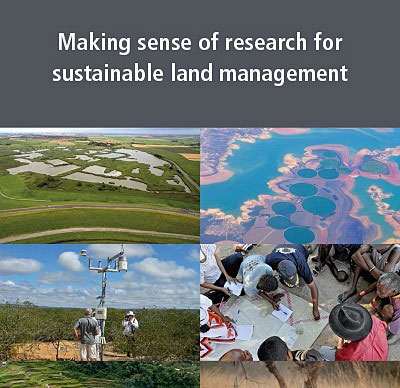
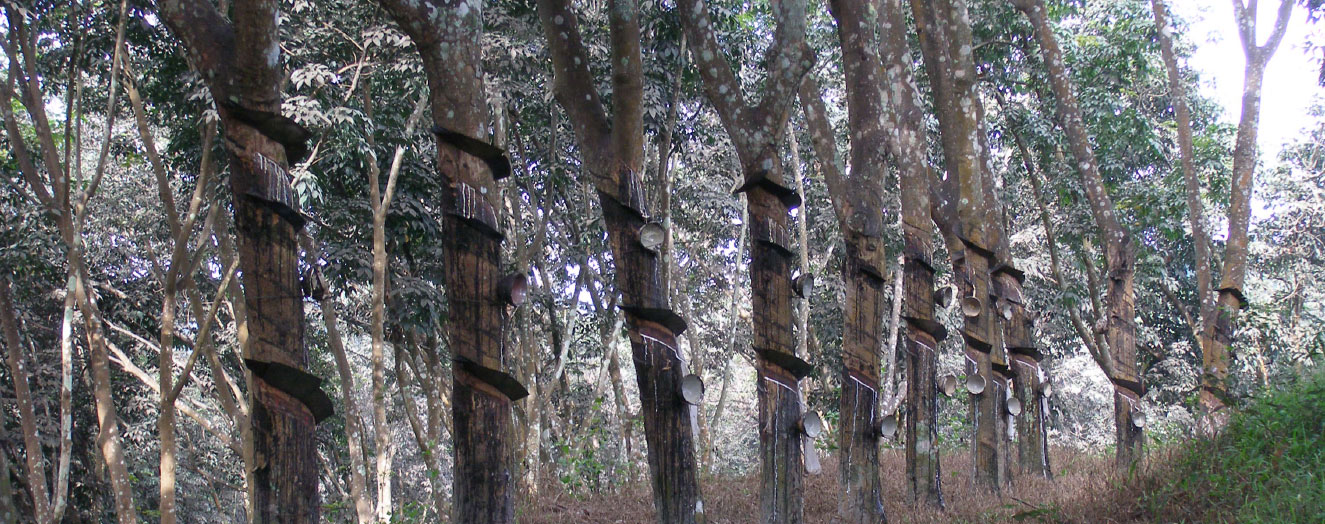
Liniger, H.P., Mekdaschi Studer, R., Moll, P., Zander, U. (2017): Making sense of research for sustainable land management. Centre for Development and Environment (CDE), University of Bern, Switzerland and Helmholtz- Centre for Environmental Research GmbH (UFZ), Leipzig.
URL: www.ufz.de/makingsense
Delzeit, R., Zabel, F., Meyer, C., Václavík, T. (2017): Addressing future trade-offs between biodiversity and cropland expansion to improve food security. Regional Environmental Change, 17(5): 1429-1441.
URL: https://doi.org/10.1007/s10113-016-0927-1
Václavík, T., Langerwisch, F., Cotter, M., Fick, J., Häuser, I., Hotes, S., Kamp, J., Settele, J., Spangenberg, J.H., Seppelt, R. (2016): Investigating potential transferability of place-based research in land system science. Environmental Research Letters, 11(9): 095002.
URL: https://doi.org/10.1088/1748-9326/11/9/095002
van Vliet, J., Magliocca, N.R., Büchner, B., Cook, El, Rey Benayas, J.M., Ellis, E.C., Heinimann, A., et al. (2016): Meta-studies in land use science: Current coverage and prospects. Ambio, 45(1): 15–28.
URL: https://doi.org/10.1007/s13280-015-0699-8
Schmidt, S., Manceur, A.M., Seppelt, R. (2016): Uncertainty of monetary valued ecosystem services – Value transfer functions for global mapping. PLoS ONE, 11(3): e0148524.
URL: https://doi.org/10.1371/journal.pone.0148524
Kehoe, L., Kuemmerle, T., Meyer, C., Levers, C., Václavík, T., Kreft, H. (2015): Global patterns of agricultural land‐use intensity and vertebrate diversity. Diversity and Distributions, 21(11): 1308–1318.
URL: https://doi.org/10.1111/ddi.12359
Mauser, W., Klepper, G., Zabel, F., Delzeit, R., Hank, T., Putzenlechner, B., Calzadilla, A. (2015): Global biomass production potentials exceed expected future demand without the need for cropland expansion. Nature communications, 6:8946.
URL: https://doi.org/10.1038/ncomms9946
Bennett, E.M., W. Cramer, A. Begossi, G. Cundill, S. Díaz, B.N. Egoh, I.R. Geijzendorffer, C.B. Krug, S. Lavorel, E. Lazos, L. Lebel, B. Martín-López, P. Meyfroidt, H. a Mooney, J. L. Nel, U. Pascual, K. Payet, N. P. Harguindeguy, G. D. Peterson, A.-H. Prieur-Richard, B. Reyers, P. Roebeling, R. Seppelt, M. Solan, P. Tschakert, T. Tscharntke, B. Turner, P.H. Verburg, E.F. Viglizzo, P.C. White, Woodward, G. (2015): Linking biodiversity, ecosystem services, and human well-being: three challenges for designing research for sustainability. Current Opinion in Environmental Sustainability, 14:76–85.
URL: https://doi.org/10.1016/j.cosust.2015.03.007
Seppelt, R., Manceur, A.M., Liu, J., Fenichel, E.P., Klotz, S. (2014): Synchronized peak-rate years of global resources use. Ecology and Society, 19(4): 50.
URL: https://dx.doi.org/10.5751/ES-07039-190450
Zabel, F., Putzenlechner, B., Mauser, W. (2014): Global agricultural land resources – a high resolution suitability evaluation and its perspectives until 2100 under climate change conditions. PLoS ONE, 9(9): e107522.
URL: https://doi.org/10.1371/journal.pone.0107522
Gerstner, K., Dormann, C.F., Stein, A., Manceur, A.M., Seppelt, R. (2014): Effects of land use on plant diversity - A global meta‐analysis. Journal of Applied Ecology, 51(6): 1690–1700.
URL: https://doi.org/10.1111/1365-2664.12329
Seppelt, R., Manceur, A.M., Liu, J., Fenichel, E.P., Klotz, S. (2014): Synchronized peak-rate years of global resources use. Ecology and Society, 19(4): 50.
URL: https://dx.doi.org/10.5751/ES-07039-190450
Václavík, T., Lautenbach, S., Kuemmerle, T., Seppelt, R. (2013). Mapping global land system archetypes. Global Environmental Change, 23(6): 1637–1647.
URL: https://doi.org/10.1016/j.gloenvcha.2013.09.004
Lautenbach, S., Seppelt, R., Liebscher, J., Dormann, C. (2012): Spatial and Temporal Trends of Global Pollination Benefit. PLoS ONE, 7(4): e35954.
URL: https://doi.org/10.1371/journal.pone.0035954
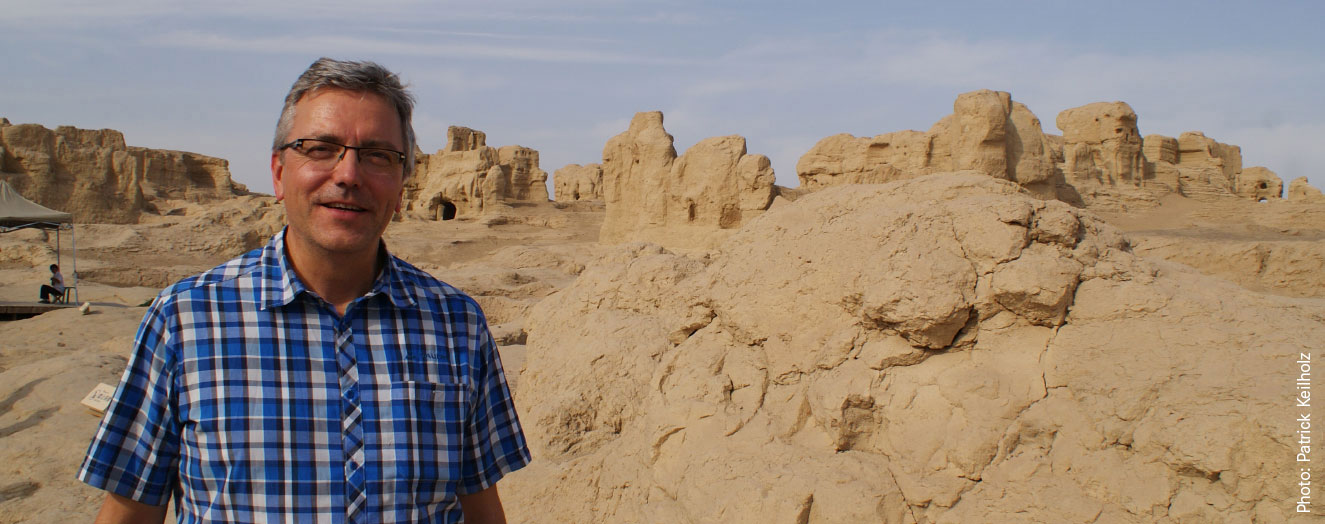
Science portrait
Global change in a regional context

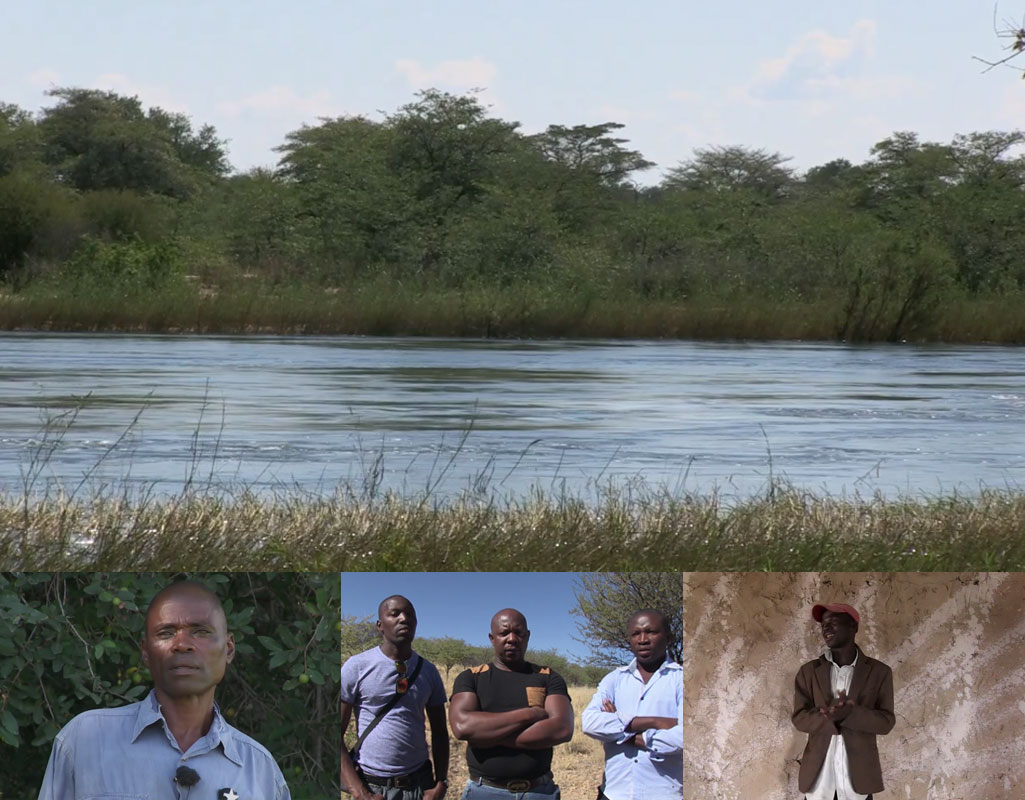
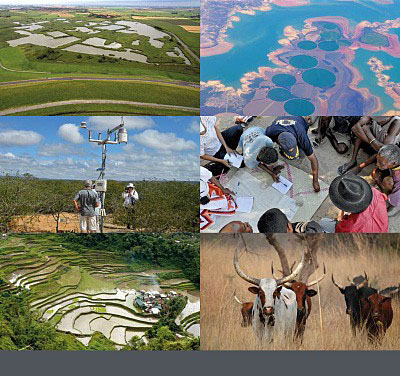
International teams of scientists are investigating changing land use in twelve regions worldwide, in a research programme funded by the German government. The GLUES scientific coordination and synthesis project aims to link up the individual sub-projects and to conduct scientific analyses. Its mission is ambitious: the project strives to demonstrate the need to use land sustainably.
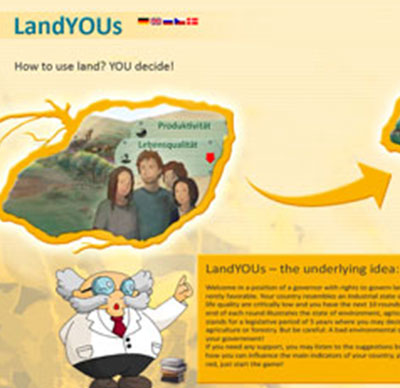
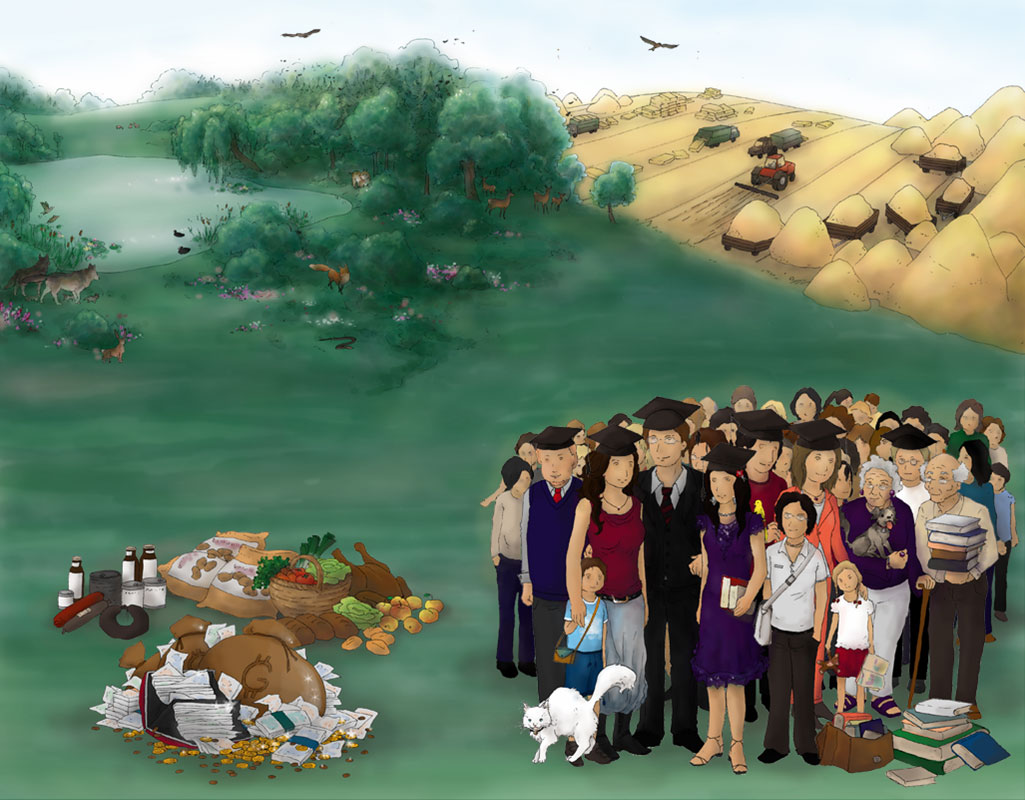
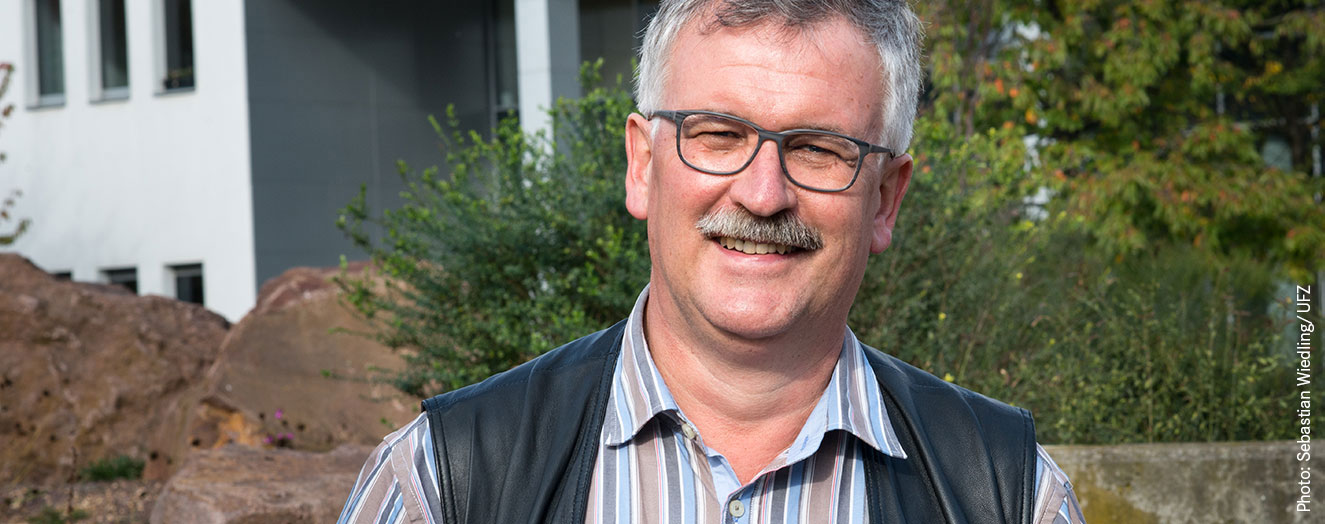
Many people dream of playing the politician and steering the fate of a country. Landscape ecologists at the Helmholtz Centre for Environmental Research (UFZ) in Leipzig have designed the computer game LandYOUs, which allows players to decide how much of the national budget they wish to invest in nature conservation, education, reforestation, urban development and farming subsidies. The priorities that they set influence the population’s living conditions: they can bring about a drop in the price of agricultural products or degradation of the environment, or force the need to import agricultural products. Anyone who resolves these challenges to the satisfaction of the population can hope for reelection at the end of their five-year term of office – otherwise the end of their political career looms. The game is not merely a challenging pastime for schoolchildren and students – it is also grounded in reality. »The computer game vividly illustrates how changes in land use affect society, biodiversity, forestry and agriculture«, says Professor Ralf Seppelt, Head of the Department of Computational Landscape Ecology at UFZ.
More than 50 million Euros for twelve sub-projects
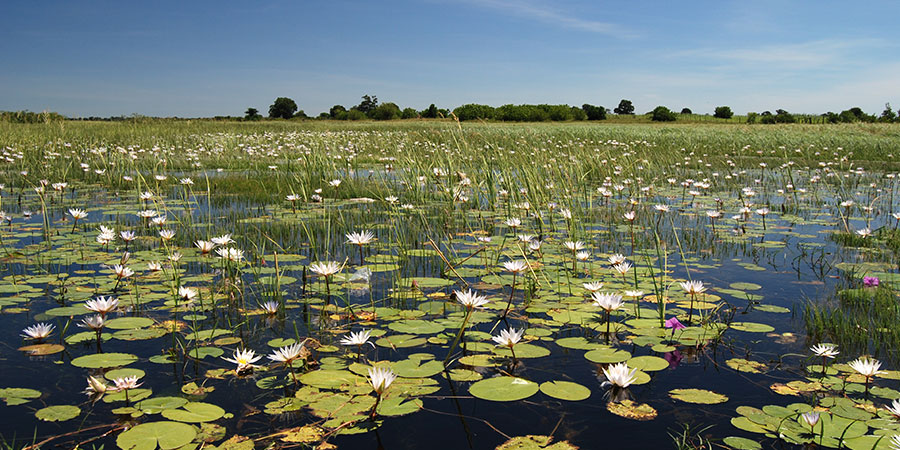
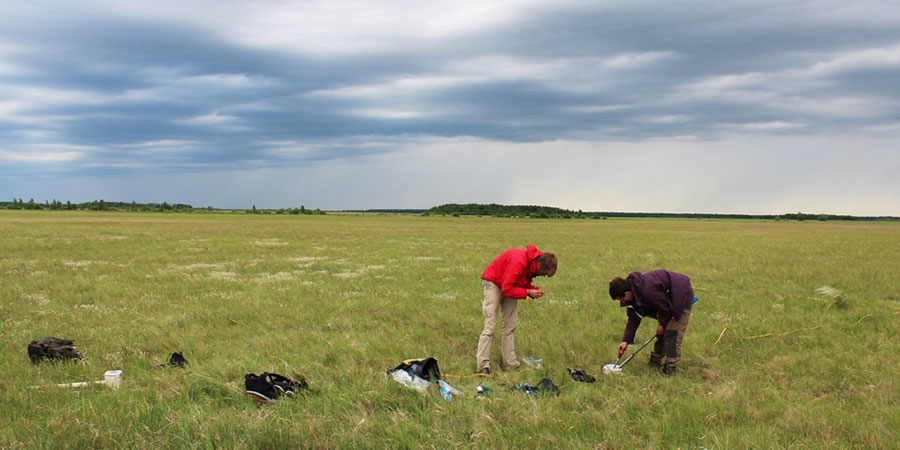
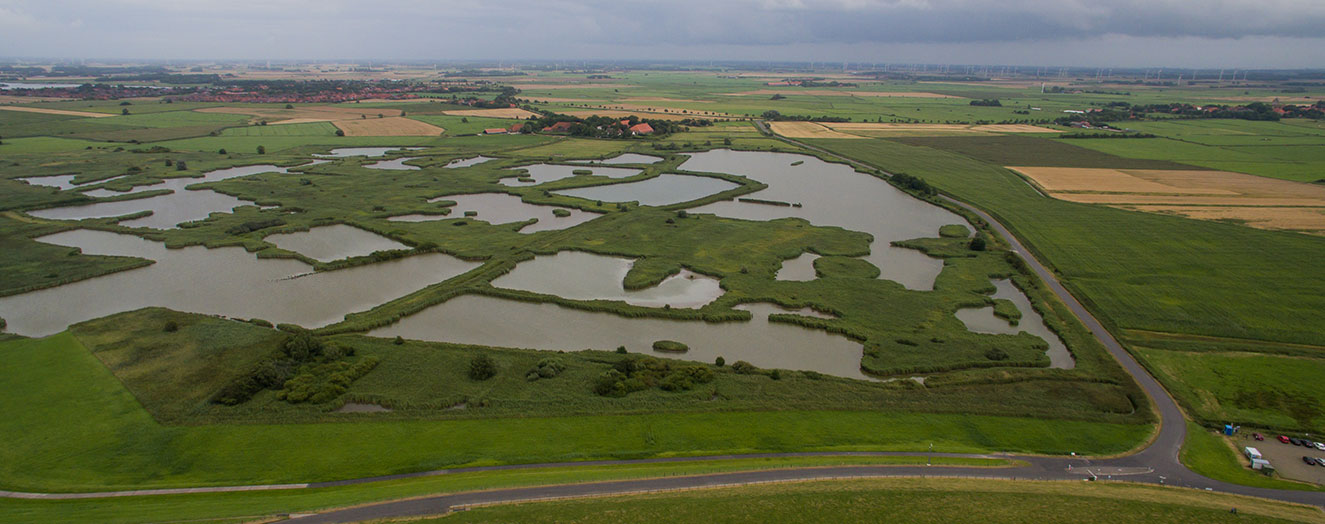
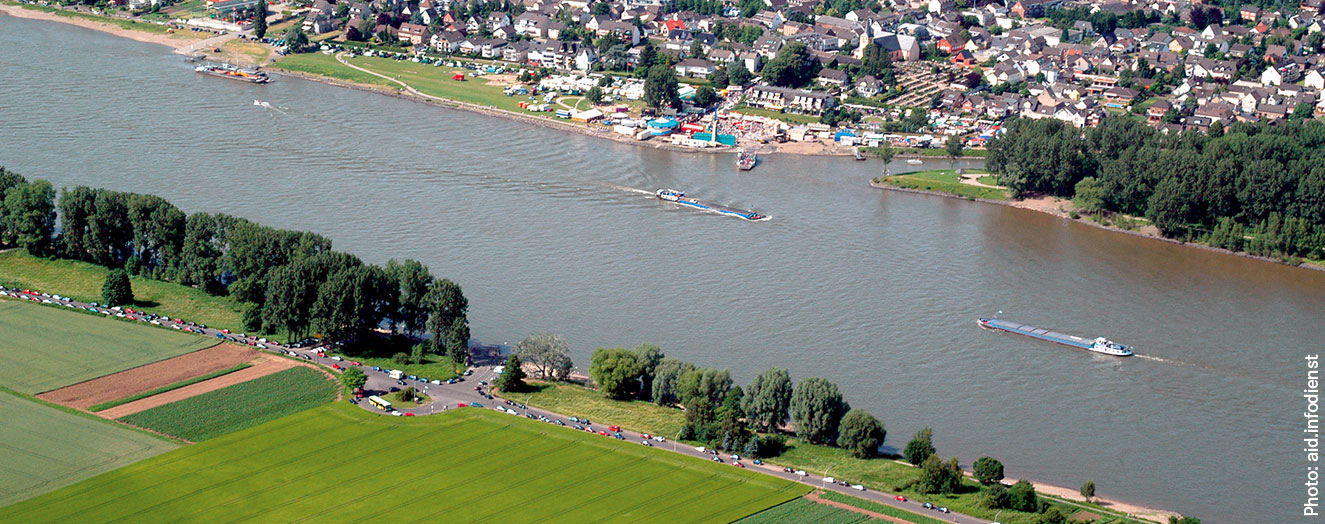
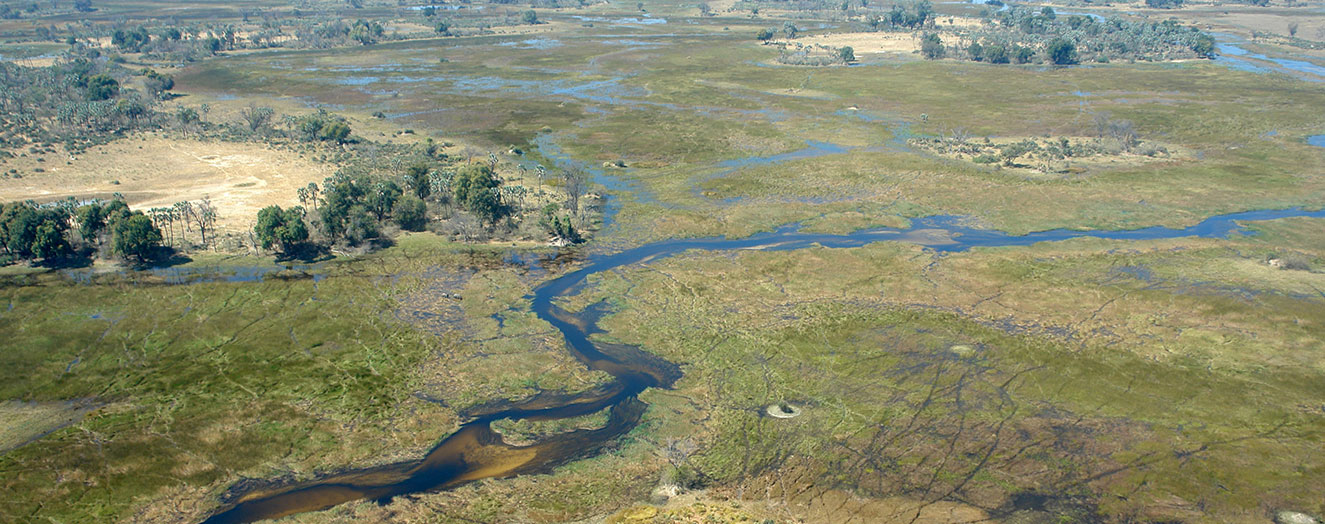
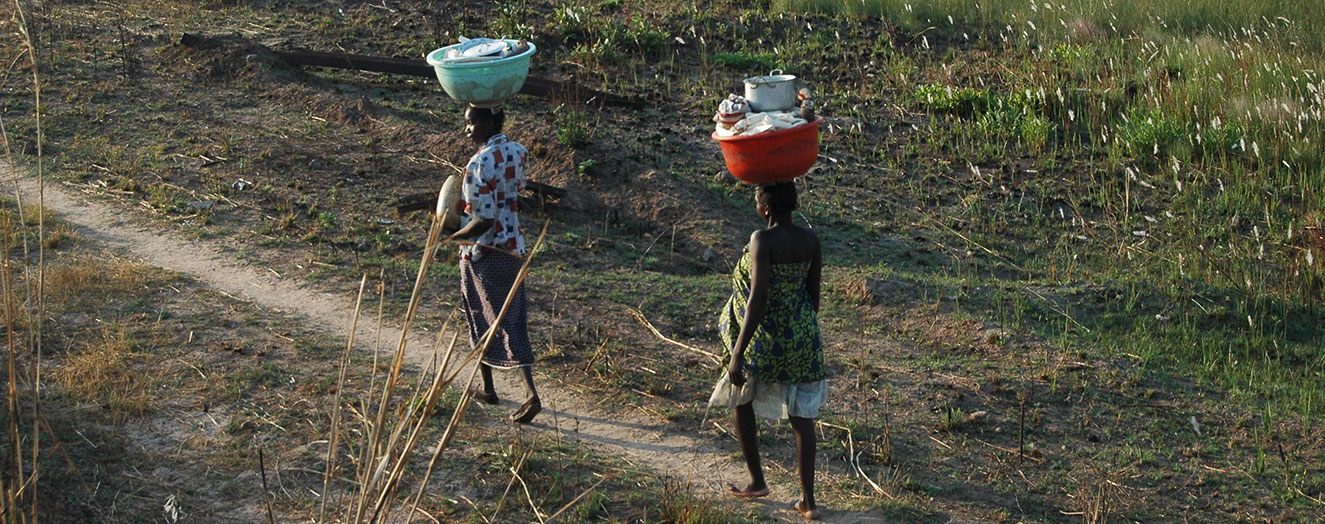
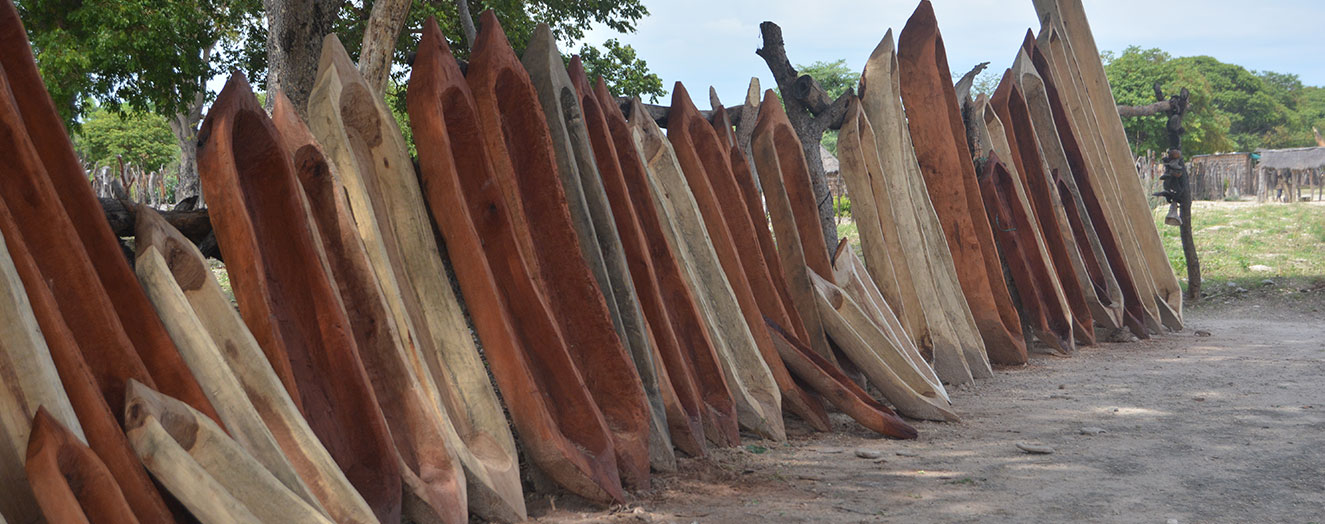
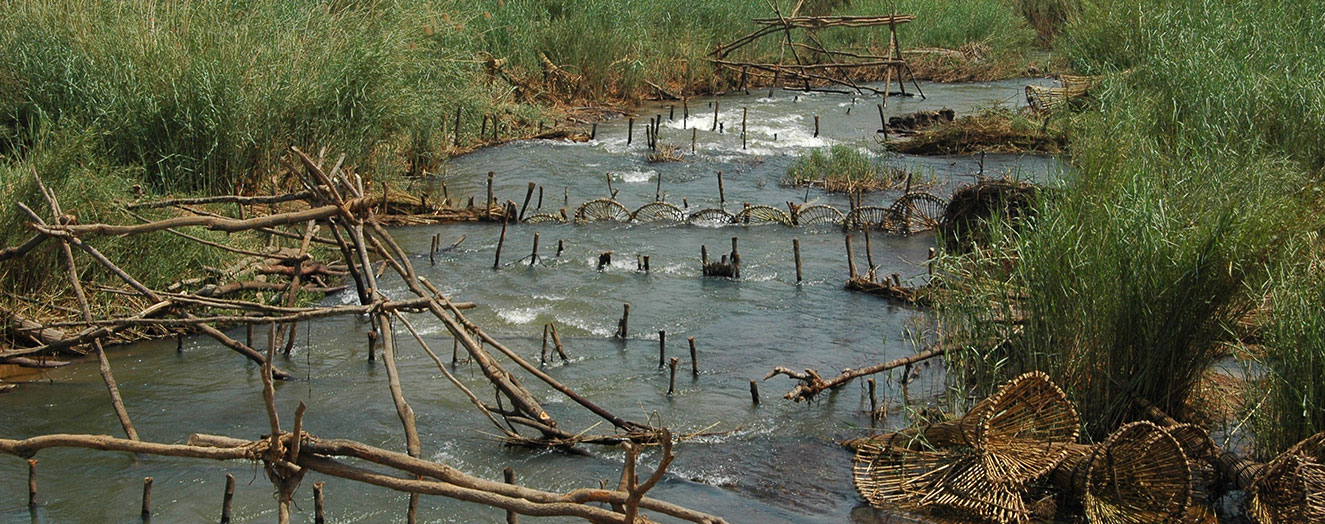
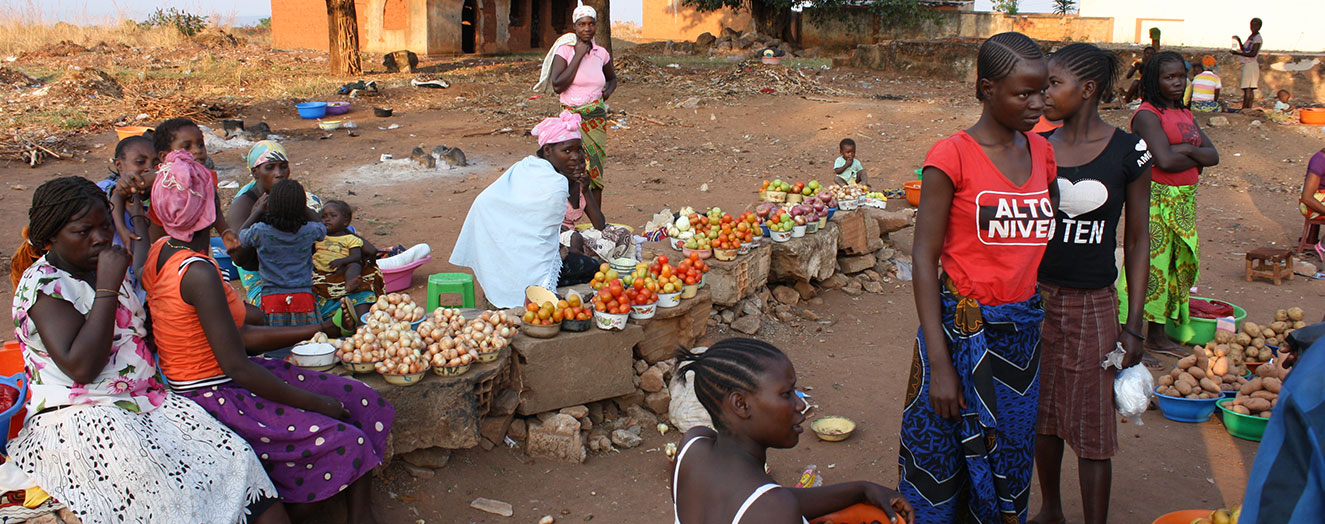
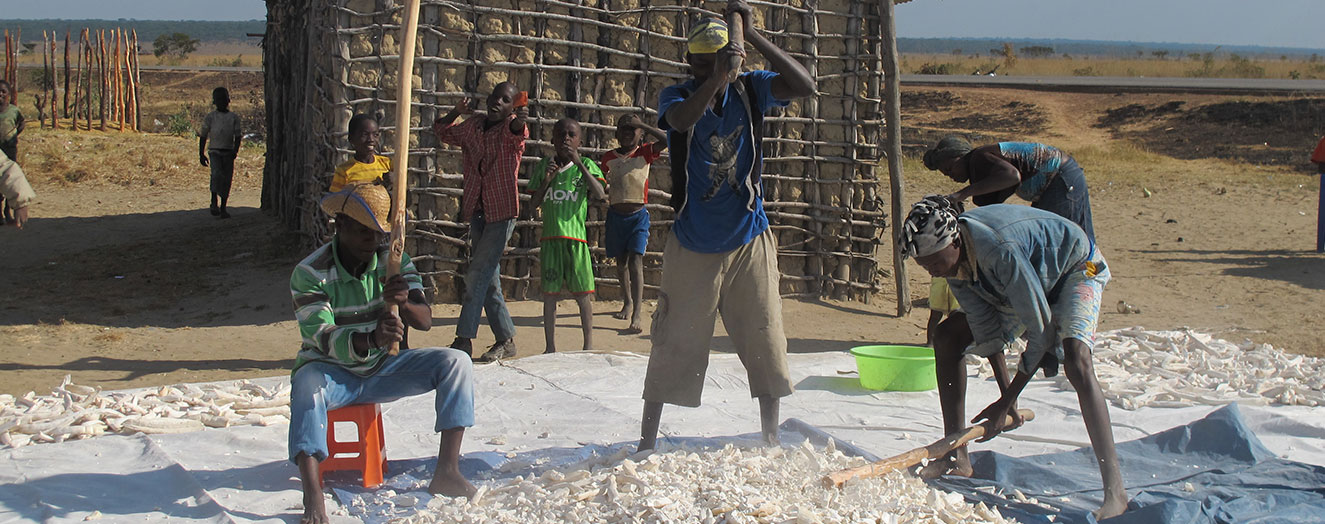
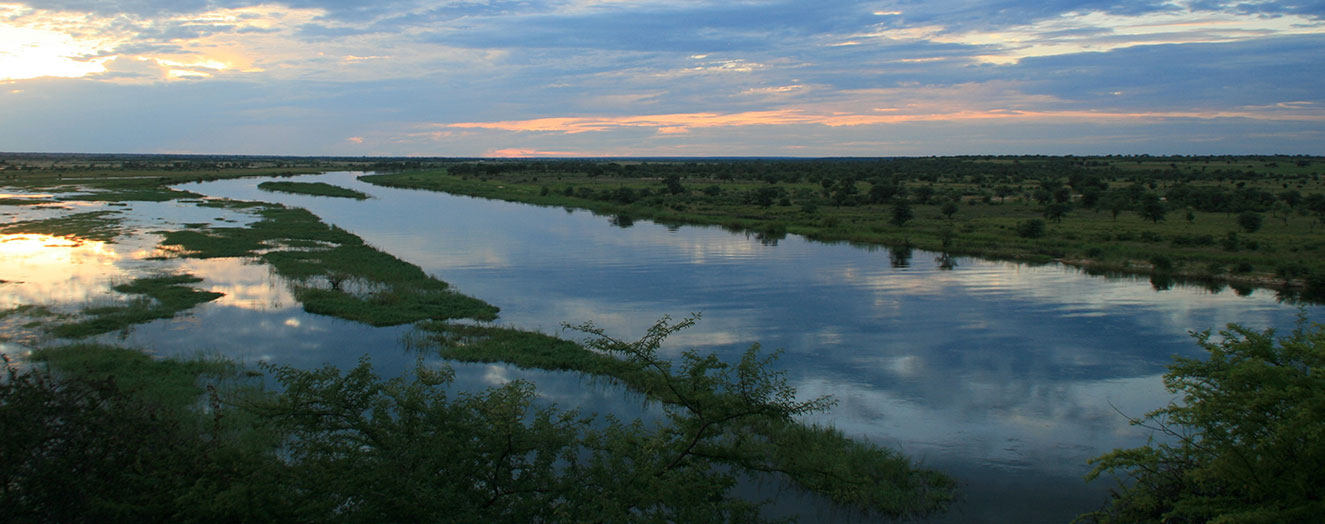
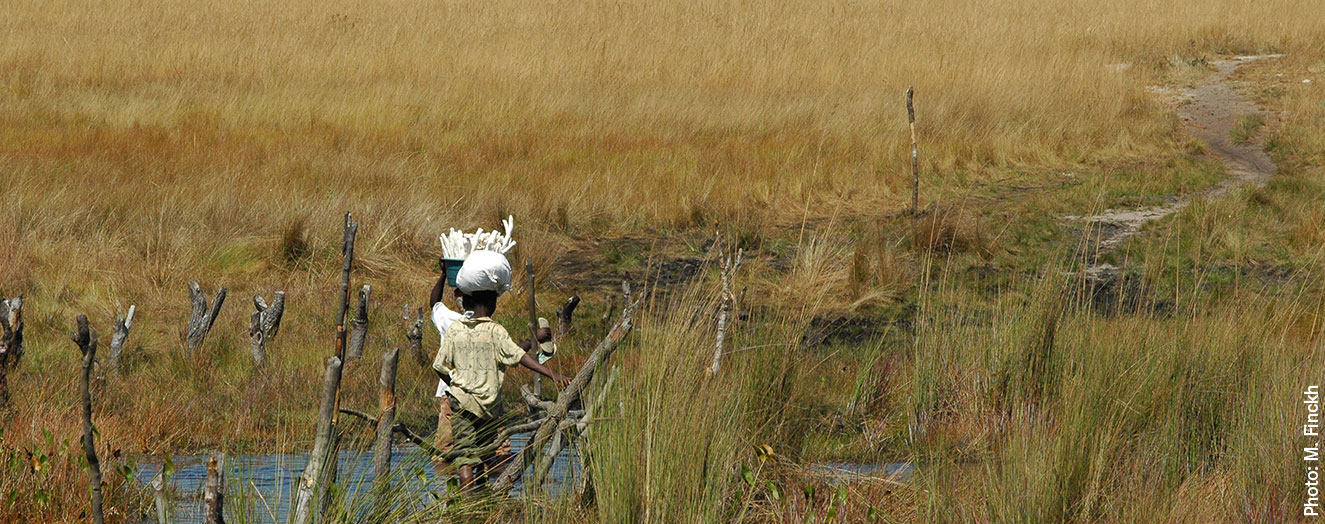
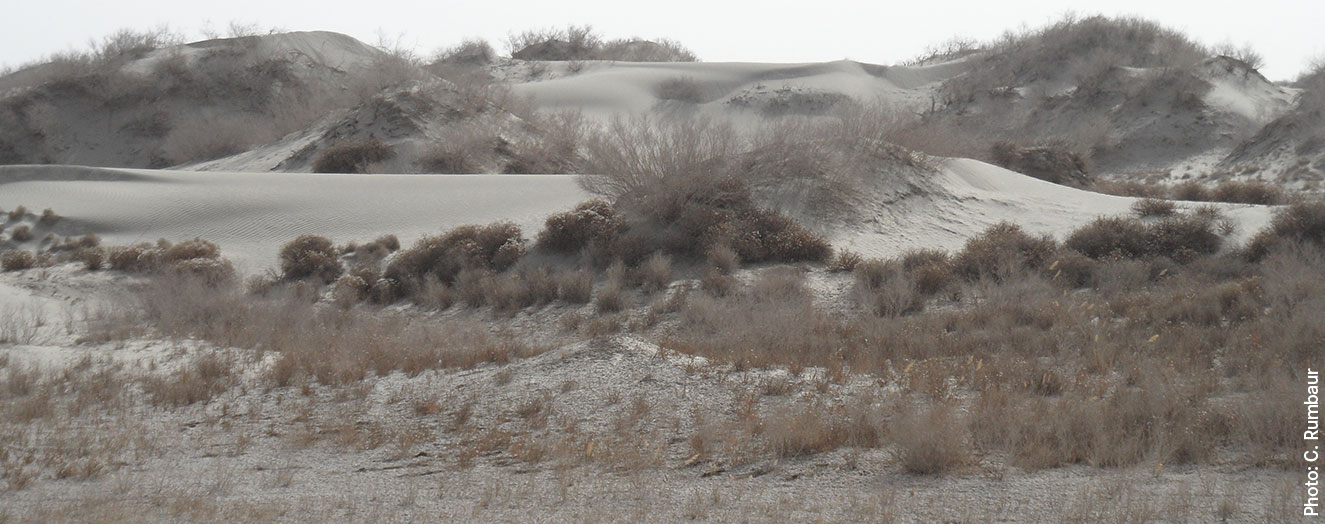
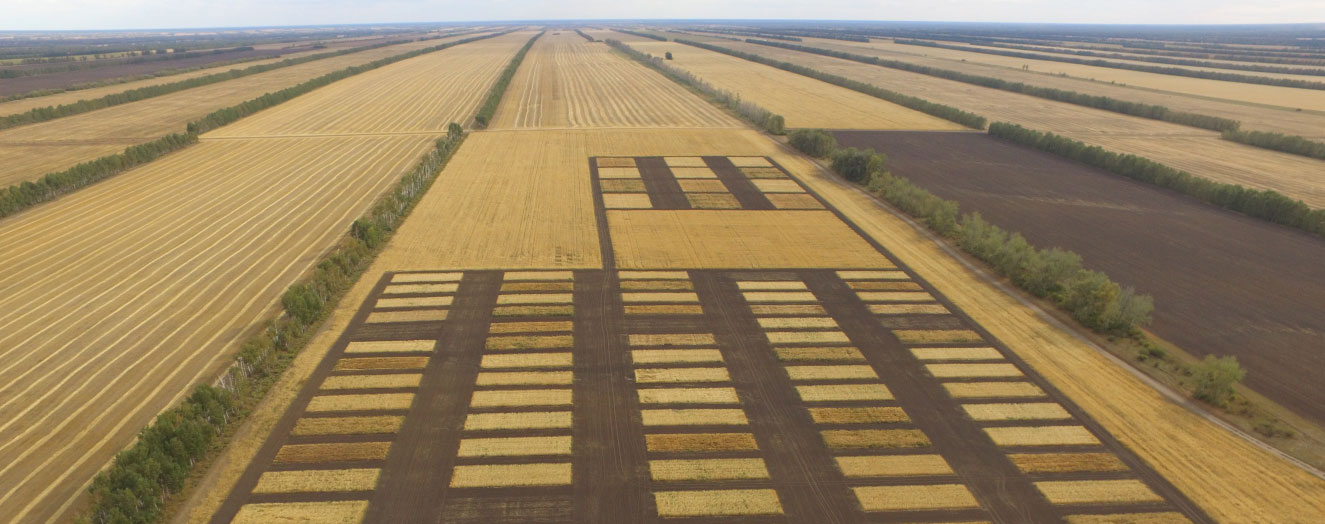
The 44-years-old landscape ecologist is one of around 500 scientists engaged in analysing the inter-actions between land management, climate change and ecosystem services worldwide in the context of the »Sustainable Land Management« funding programme. The German Federal Ministry of Education and Research (BMBF) is providing around 50 million Euros in funding for twelve projects in global regions running until 2017. In these projects, international research teams are investigating the effects of changes in land use for example in the Amazon Basin, the Siberian Steppe, the Okavango Delta in Africa and along the Baltic and North Sea coasts of Germany. Seppelt and his colleagues in Leipzig are leading the accompanying scientific project with the acronym GLUES (Global Assessment of Land Use Dynamics, Greenhouse Gas Emissions and Ecosystem Services). The GLUES team has several tasks. Firstly, it aims to link up the individual projects and communicate the results to the general public and to experts in the form of conferences, videos and Science portraits. This role is intended to facilitate the work of the project scientists.
The GLUES team also faces scientific challenges: »We are treading new ground with this programme in that we are putting together results from research projects with a regional focus in order to provide globally consistent scenarios and models. Thus we are able to analyse interactions, combine practical management measures from the regional projects and test these for transferability«, says Seppelt, who sees the project as a blueprint for other projects: »We ensure that these trials are also embedded in global processes.
Land use causes emissions
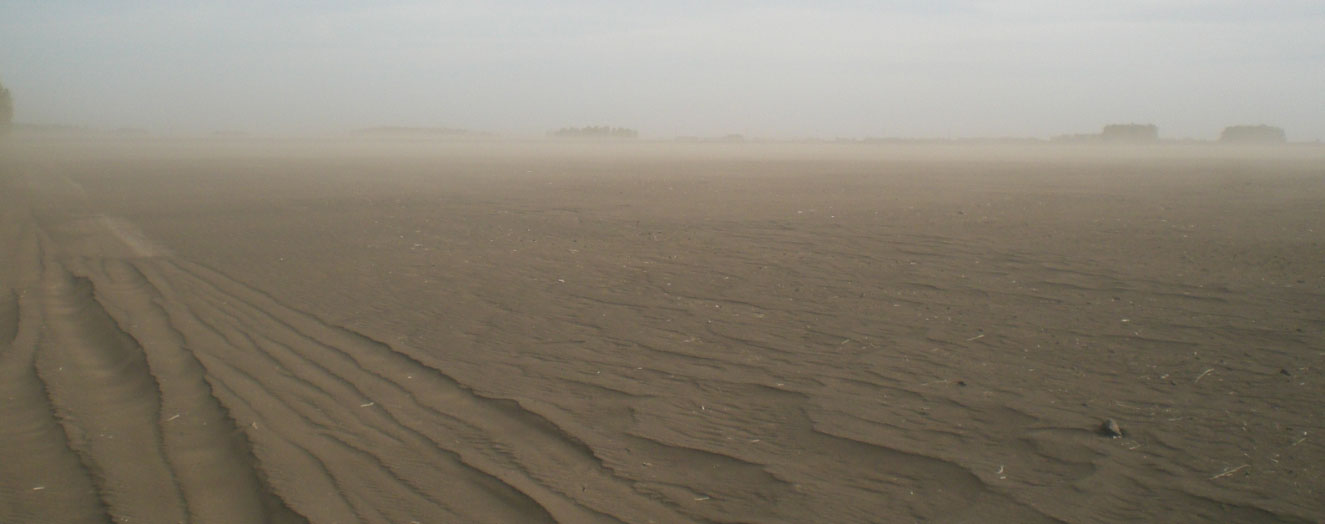
Scientists all agree that global change has been under way for a long time already. Renowned scientists have already described some of the consequences. »Between 20 and 30 percent of climatically relevant emissions worldwide are generated by land use and changes in land use«, says GLUES project leader Seppelt. Although globally around eleven percent of the Earth’s land surface is protected, many animal and plant species are still dying out every year. With less and less land available for humans to utilize, management of the Earth’s land surface must change – especially management of the 35 percent that is agricultural land. »Many regions are not as productive as they could be«, says Seppelt. The people lack resources and the soils are eroded; eco-system functions are being lost, and climate change demands changes in farming practices.
Global scientific scenarios are therefore an important element of the GLUES project. In one GLUES work area, research scientists at the Potsdam Institute for Climate Impact Research (PIK) are calculating how potential land use might change by 2100. Professor Gernot Klepper, Head of Environment and Natural Resources at the Kiel Institute for the World Economy, is investigating the mid-term perspective until 2030 in conjunction with colleagues from the University of Munich and the GEOMAR Helmholtz Centre for Ocean Research in Kiel. »We have broadened the scope of economic general equilibrium models, which are often used for climate policy or trade policy analyses, so that they can be used to analyse land use and bioenergy subsidies and how these compete with food production,« explains Klepper. The model simulates yields from the eighteen most important food crops such as wheat, soya and maize. This provides a basis for investigating the effects of biofuel subsidies on the agricultural markets and other energy markets such as oil, gas and coal. Five global scenarios describe and analyse how possible developments such as bioenergy subsidies or an increase in meat consumption might appear.
Klepper is hoping that this will provide important insights into global food security and the yield potential of agricultural products. The scientists are already able to reveal their initial findings: »The yield potential from agriculture is higher than previously realized«, says Klepper. In previous studies only the present land use was considered, without taking account of the fact that further yield potential could be tapped by changing the crops grown. »These effects could be very great, because the cropping patterns on which previous calculations are based make no sense under other economic conditions or with higher productivity«.
Seppelt and his colleagues are also working on an analysis of land systems based on global land use data. The GLUES scientists have evaluated over 30 global datasets relating to the environment, agriculture and socioeconomics in order to identify twelve so-called archetypes. These archetypes range from extensive agricultural use and tropical forest systems to subsistence farming and irrigated agriculture. Seppelt sees the archetypes as an important first step: »They help us to understand the interactions that exist between human activities on the one side and social and environmental changes on the other side«. The analysis is innovative in that the scientists have used significantly more data and indicators than usual. »We did not know for example in which regions agriculture could be further intensified or in which regions intensive cultivation had already reached its limits«, explains Seppelt. Information that would normally be swallowed up in the complexity of the data is thus made visible. »For example: if we had analysed only environmental indicators, we would not have been able to ascertain the regions where agriculture yields high profits.«
Databank for scenarios
To ensure the successful transfer of results between GLUES and the projects in the funding programme, the team led by Professor Lars Bernard from the Dresden University of Technology (TU Dresden) has built up a geodata infrastructure with a scientific geoinformation portal. This contains global data for the regional projects such as climate scenarios and information on land use, biodiversity and water resources. The research partners can access and exchange information through the portal. »The global information consists of basic data which serves as reference data for all the projects and enables the scientists’ research«, says Bernard. However the two tools are not for the sole use of the research scientists involved in the BMBF funding programme – anyone conducting research in one of the twelve regions or investigating land use can access information or upload data onto the portal.
While this might sound simple, in reality it is a complicated task. »For the data to be used by everybody a common language is required – otherwise chaos ensues«, says Bernard. This means common rules and standards. Where the standards used in the past are not sufficient, the computer geoscientists have to develop them further – this was the case with the multidimensional research data in particular. Many scientists regard the provision of such data with scepticism because it involves additional time and effort. But as Bernard explains, the work is important because it means that the data will still exist and remain available for use after the end of the project. Bernard also wishes to avoid uploading too many datasets onto the portal. »The objective is not to gather as much data as possible, but rather to provide relevant and coordinated information«.
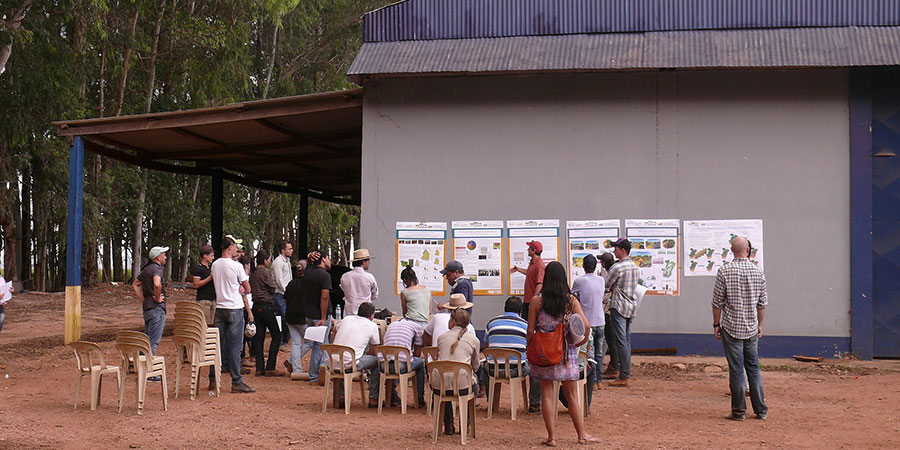
Help for regional stakeholders
Sustainability is also important in another GLUES work area. Consultants Dr. Peter Moll and Ute Zander are assisting the scientists in their dealings with the local stakeholders. They offer training, individual advice, analyses and ideas for possible practical uses of the results in their regional projects. They also make contact with the authorities, agricultural associations and nature conservation organisations on an international level. »We look for local bodies which would welcome the opportunity to use the practical, implementation-oriented results from the regional projects«, says Moll. He and his colleague are in contact with food and agriculture organisations such as the European Environment Agency – EEA and the European Commission.
Their endeavours have already borne fruit. The European Environment Agency for example plans to post the results from the BMBF funding programme on the web pages of the environmental observation platform Eye on Earth. Here farmers, agricultural associations and nature conservation bodies worldwide would be able to document changes in land use via the internet. The consultants also wish to publish a book and videos describing the approaches and techniques for more sustainable land management practices developed by the project scientists in cooperation with local and regional stakeholders. »In this way the practical results from the whole programme could be made accessible and documented. The land users involved in the funding programme worldwide could then continue this work«.
Dr. Cornelia Paulsch, Director of the Institute for Biodiversity in Regensburg and a member of the GLUES research team, is also ensuring that the GLUES results are widely disseminated. »We help the scientists to ensure that the results of their research are taken into account in important international political processes and environmental agreements«, she says. These include for example the UN Convention to Combat Desertification (UNCCD), the UN Framework Convention on Climate Change (UNFCCC), the Convention on Wetlands (RAMSAR) and the Convention on Biological Diversity (CBD). This is an important aspect of the project because the resolutions and programmes within the agreements are constantly revised and new themes added. »There is a need for scientifically substantiated facts, so that the study groups in the committees can make well-founded decisions«, Paulsch emphasises. Scientists should therefore contribute their expertise to the agreements. Awareness of the international agreements is not very widespread however. Paulsch is therefore organising training for the scientists involved in the regional projects. »The aim is to help the scientists to determine how they can best put their findings across at conferences on the agreements«, she says.
GLUES project leader Seppelt hopes that the BMBF project will not only have lasting effects but will also be a model for other solution-oriented research projects. »Land is a limited resource and must be used sustainably, because our natural basis for life is preserved only if our environment is not harmed in the long term«, says Seppelt. This is the message that the GLUES research team wishes to communicate – whether through conferences, videos, books or even a computer game.
Download Science portrait