WP 4 – Optimisation of objective functions and related policy options
Lead: UFZ, participating Agroscope, UPM, IMDEA, VU, BOKU, IfLS

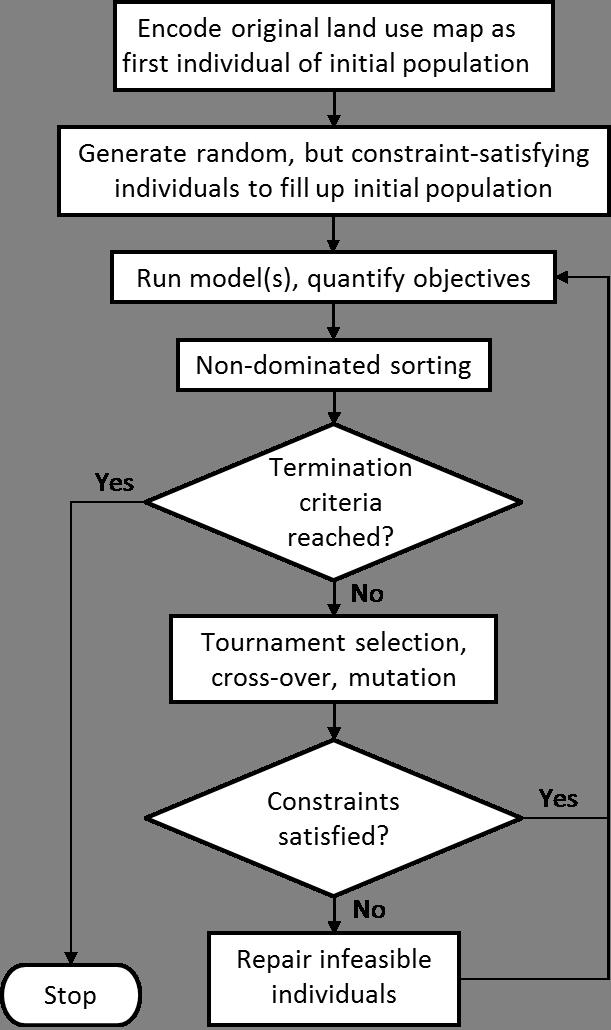
The optimization for the TALE case studies will be carried out using the Python environment CoMOLA (Constrained Multi-objective Optimization of Land-use Allocation). CoMOLA utilizes the Non-dominated Sorting Genetic Algorithm-II (NSGA-II) to optimize land-use raster maps for multiple objectives under consideration of basic land-use change constraints, including the minimum and maximum total area of certain land use classes as well as transition rules controlling which land use classes are allowed to be replaced by which other. CoMOLA includes functions for reading, encoding and writing land use maps as well as different constraint-handling methods coupled to NSGA-II, such as a tabu memory based repair mutation method to allow a more efficient exploration of the feasible solution space. A flowchart of the optimization procedure using repair mutation is given in Figure 1.
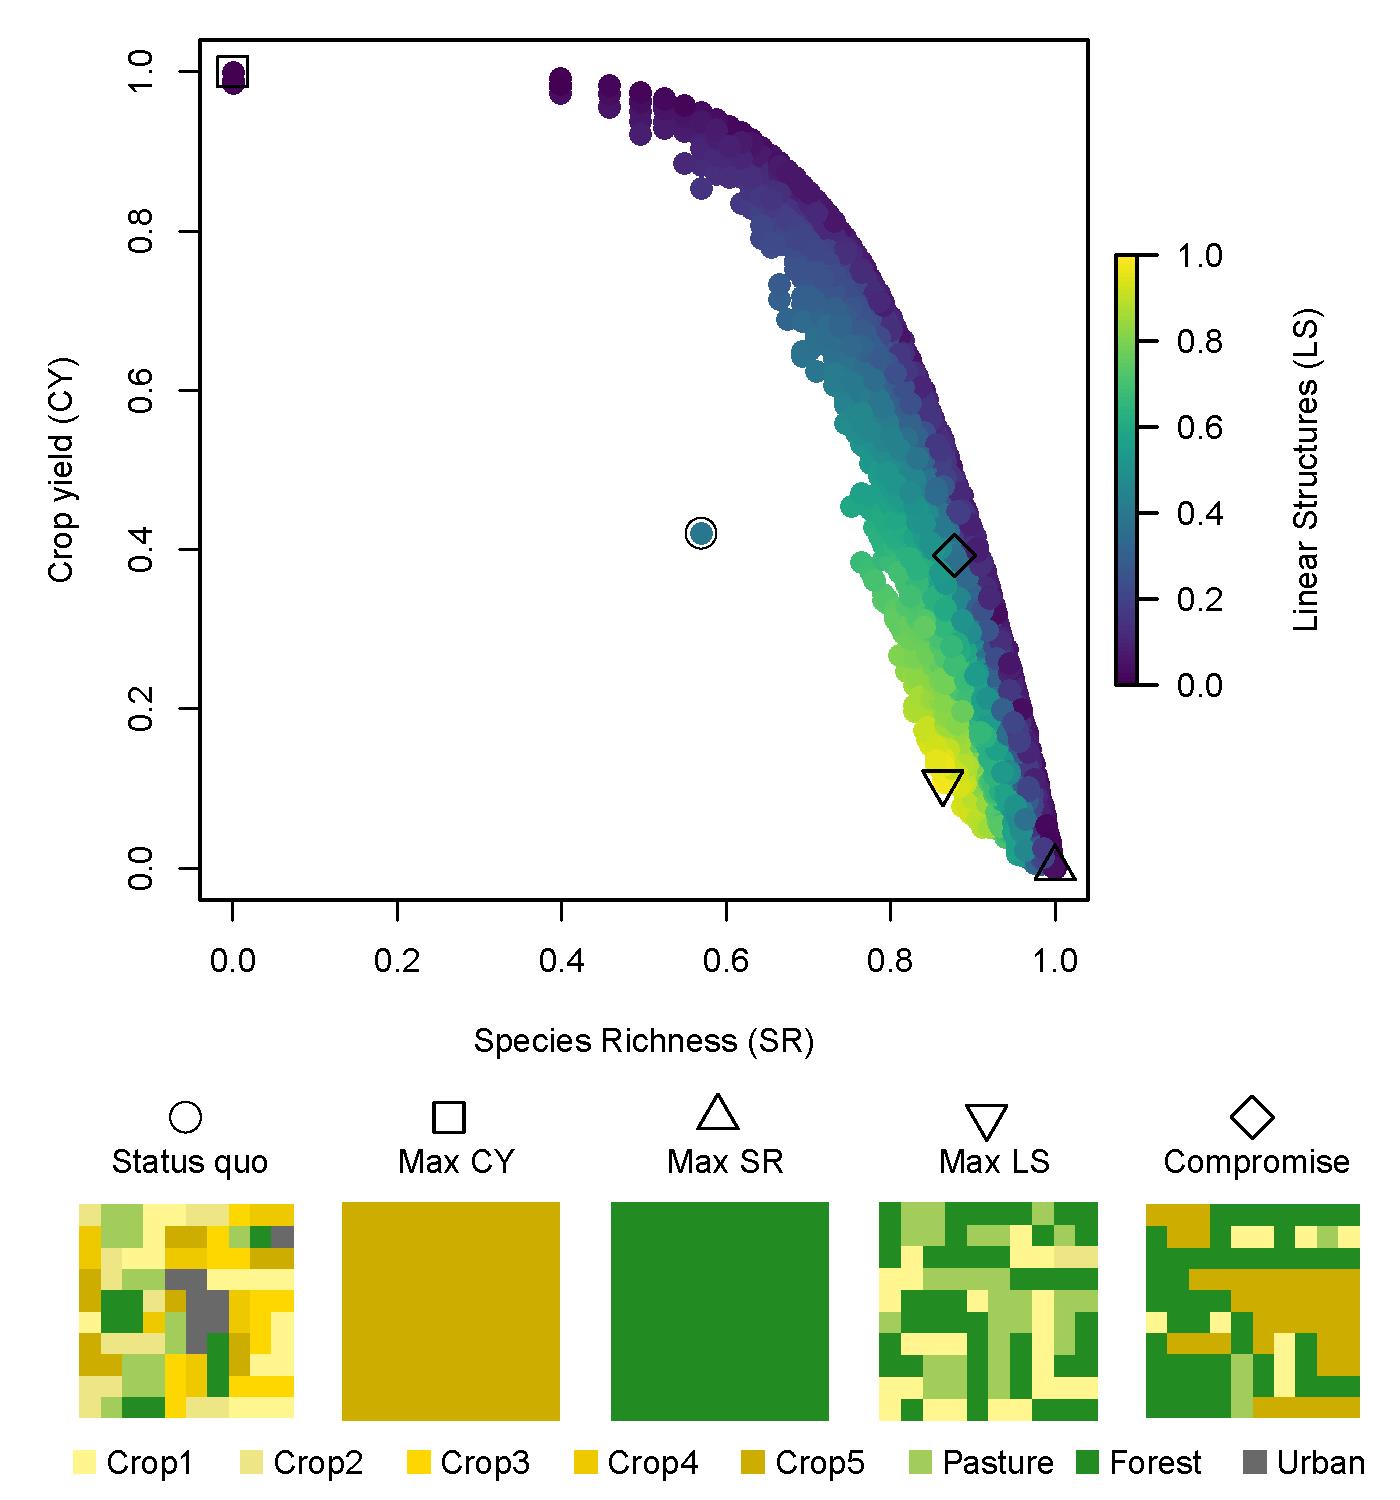
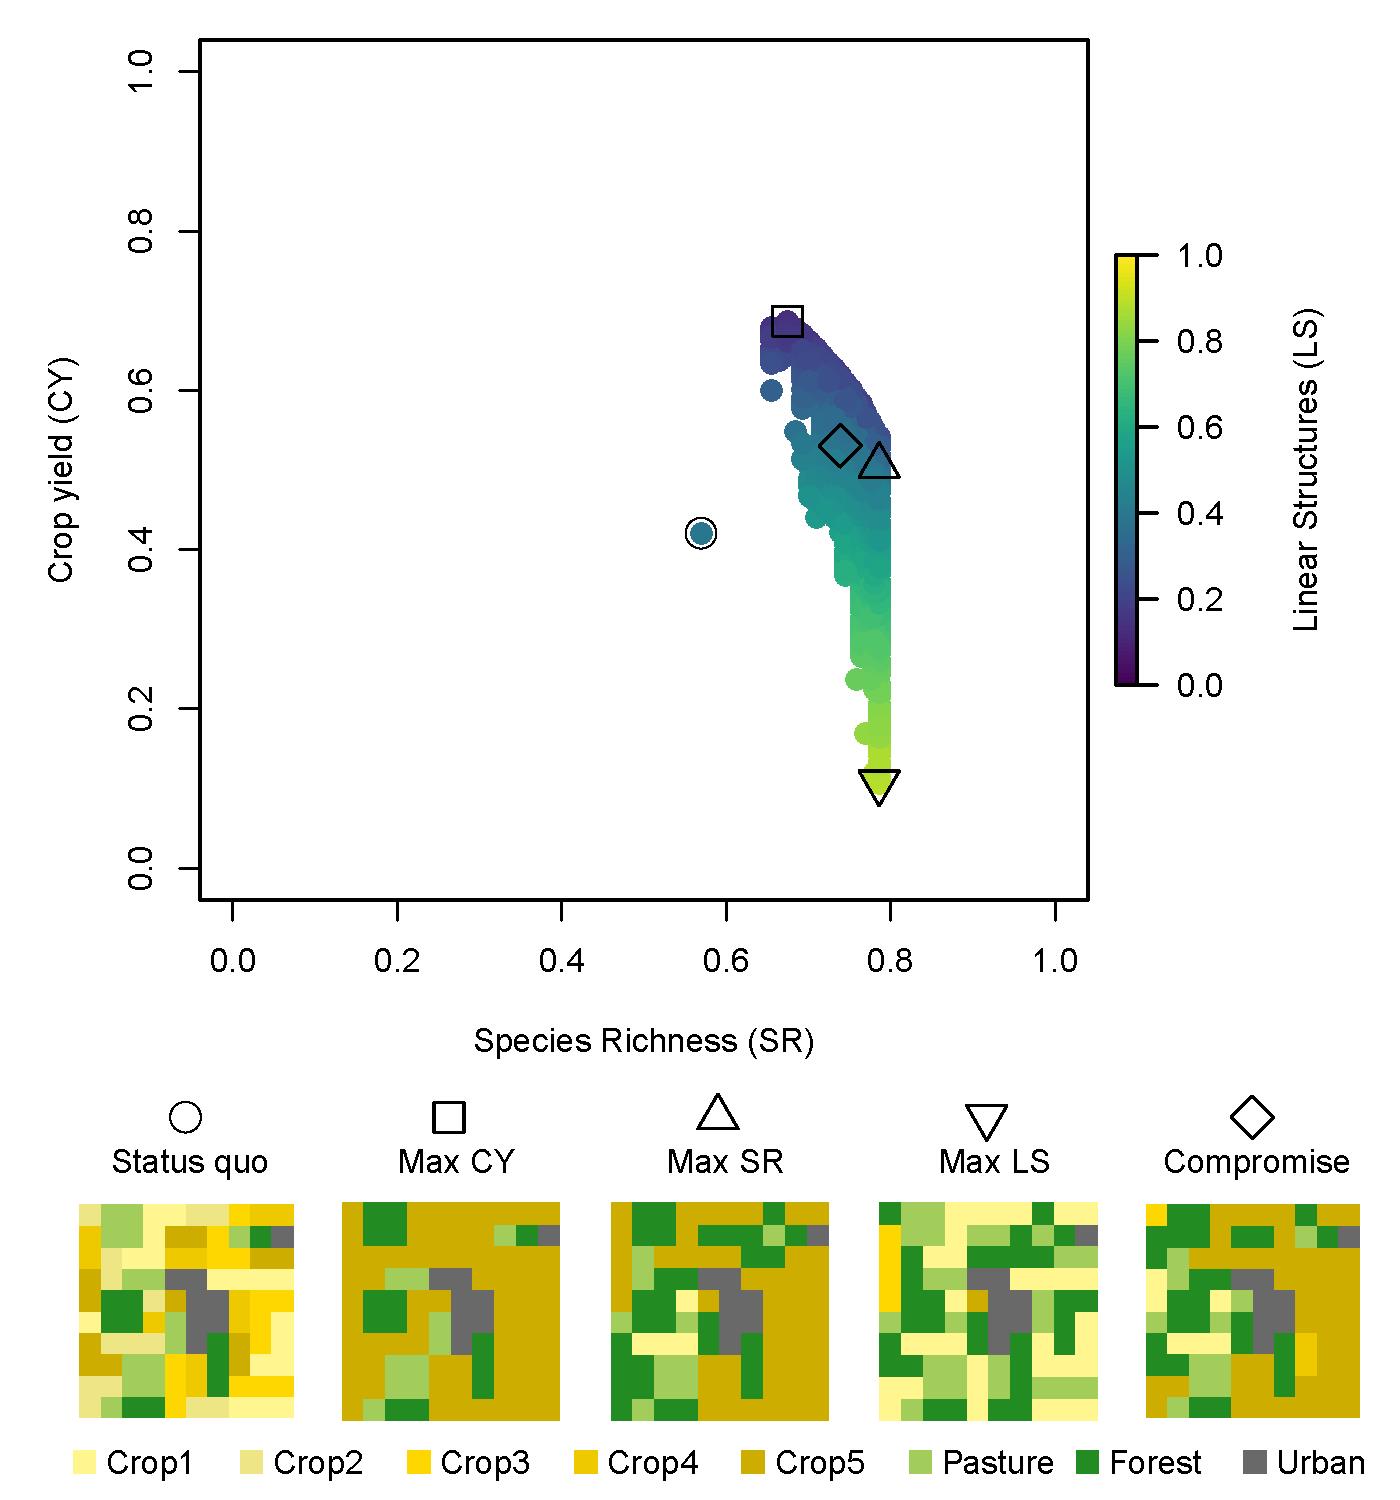
To illustrate the functionality of CoMOLA, we applied the algorithm to an artificial land use map which ought to be optimized for multiple conflicting objectives (maximizing crop and water yield as well as biodiversity indicators, for estimating each of the objectives we used simple R-scripts). Our test results show that CoMOLA is able to approach Pareto-optimal land use maps for up to four objectives (Figures 2 and 3 show exemplary results for a three-dimensional optimization test problem). We found that the feasible solution space could be explored more thoroughly by applying a repair mutation after normal tournament selection than applying penalty functions in a constrained tournament selection. In the next step, CoMOLA will be applied to the TALE study regions. For that purpose, we need to integrate case study specific models and land-use change constraints.

Figure 2: Exemplary optimization results for an artificial landscape without considering land-use change constraints

Figure 3: Exemplary optimization results for an artificial landscape considering specific transition rules and area proportion constraints

