Work Package B: Decentralised wastewater management
October 2017 - December 2017
Further work has been carried out on the scenario development and analysis. A total of six scenarios have been prepared, equally split between the rural area (three scenarios) and the urban area (three scenarios). In both study areas, the scenarios compare high decentralised wastewater management options to clustered and/or semi-centralised management options.
For each scenario, an analysis of the technical components has been prepared, including the total number and size of each wastewater treatment system, the length and type of sewer lines and the number of manholes and pumping stations required.
This inventory of technical equipment represents the basis for a life cycle cost assessment of each scenario, by calculating the cost for investment, reinvestment and operation and maintenance.
The scenarios have been compared on both a technical and economic basis. The comparison enables to identify the most suitable scenario for wastewater management over the life span of the project (here set at 30 years). A scenario qualifies as “most suitable” if it is more cost efficient than other scenarios while being technically simpler. Of particular interest for the technical evaluation are the operation and maintenance requirements which can become challenging if the technology-base is much diversified and if the number of system installed is high.
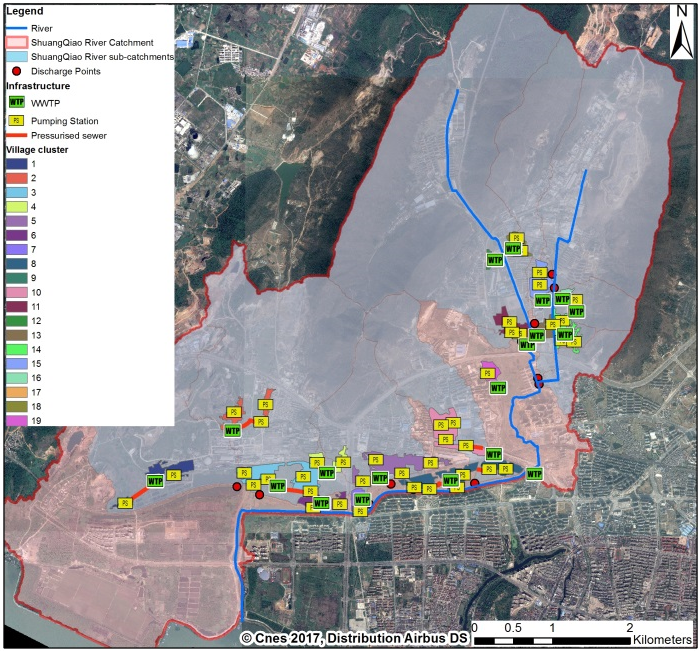
Fig 1: example of scenario for the urban areas
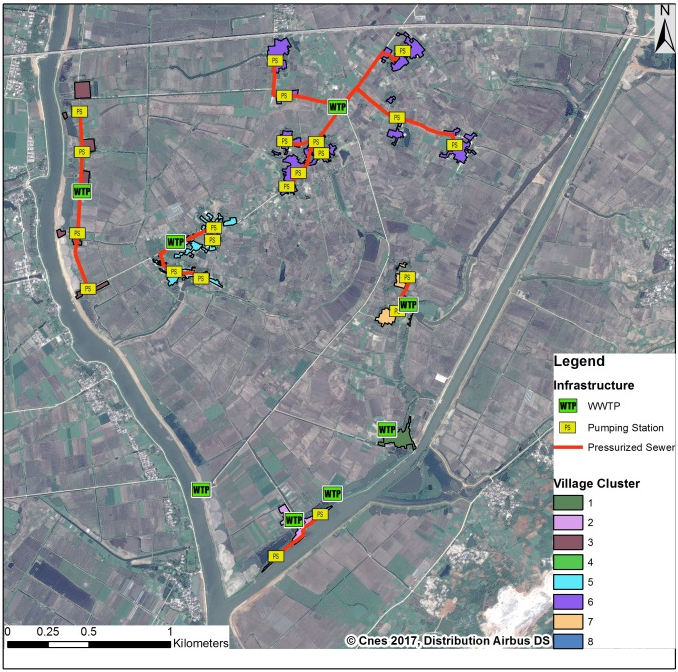
Fig 2: example of scenario for the rual areas
July 2017 - September 2017
During the reporting period, the main activity consisted in:
Processing of the 1m-accurate satellite data has been started. Focus has been put on the analysis of the urban area in order to refine the decentralised wastewater management scenario previously prepared. After delineating the urban villages previously identified, the micro-catchments where these villages are located have also been delineated. The two first scenarios have been mapped:
• Scenario 1: village micro-catchments (Figure 1 left)
• Scenario 2: discharge points (previously observed) micro catchment (Figure 1 right)
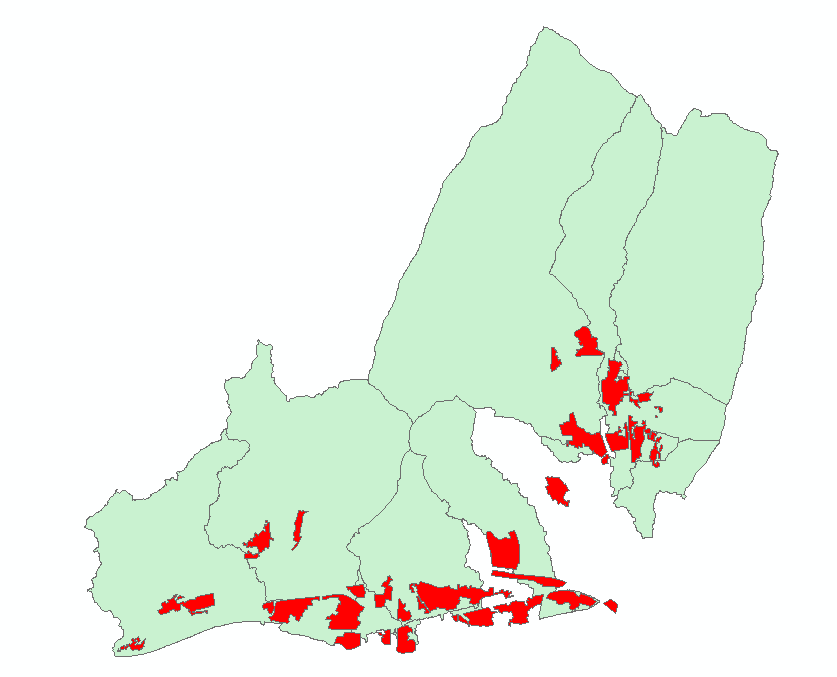
Fig 1: Visual representation of scenario 1
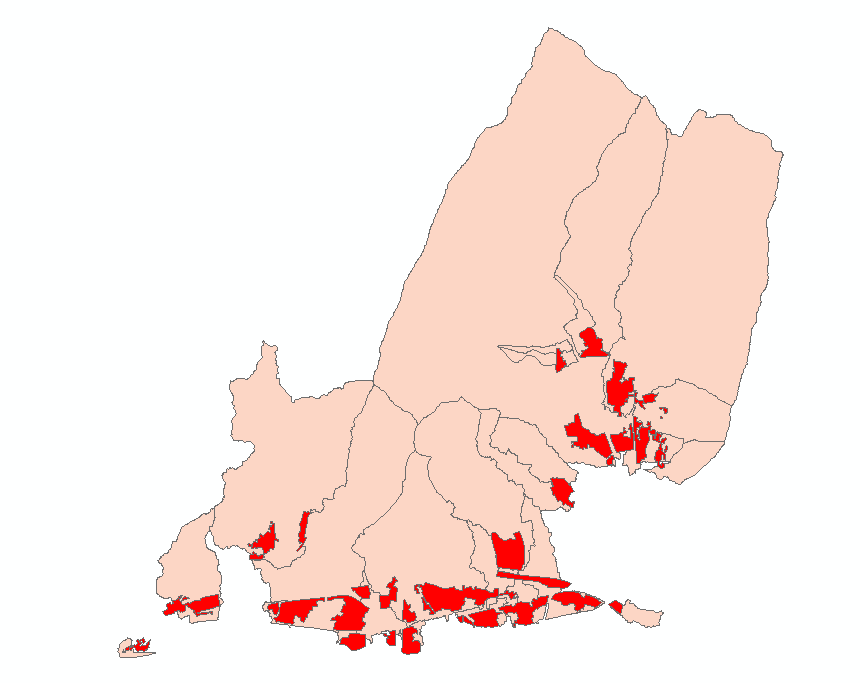
Fig 1: Visual representation of scenario 2
From this delineation, the number of wastewater treatment plants and their location can be evaluated and matched with cost data from similar projects. A last urban scenario will be prepared by modifying the delineation of villages and micro-catchments. This will enable to reduce the number of wastewater treatment plant but will require the use of pumping station as it will not be possible to consider the use of gravity sewer for the entire area.
Similarly, scenarios will be refined to fit the rural area. Indeed, a preliminary analysis showed that the rural area selected is extremely flat, meaning that collection and transport of wastewater through gravity sewer may not work and/or present risks to the environment (leakage or groundwater infiltration).
January 2017 - June 2017
During the reporting period, the main activity consisted in:
Finalisation of the visual mapping of waterways, in rural and urban “test” areas.
For the urban “test” area: localisation on the river map of the information (wastewater discharge points and grab sampling points for water quality).
Preparation of six wastewater management scenario for the two “test” area. The level of definition of the scenarios reflects the quantity and quality of information available. The scenarios consider the population connected, the wastewater production and the pollution load estimated for carbonaceous compounds and nitrogen. The number of wastewater treatment systems for each scenario depends on a preliminary topographical evaluation of the area.
Accurate (1m) satellite data (topography) has been received on the 16/05/2017 and has been transferred to the project partners. Preliminary evaluation of the data has been performed, prior to the scenario update.
June 2016: Waste Water Infrastructure Module interface to the UC Environmental Information System available
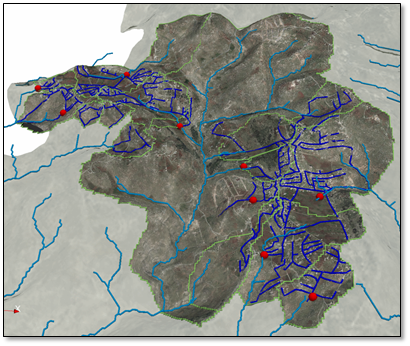
The new version of the Urban Catchments Environmental Information System (UC-EIC 1.1) provides an interface to the Waste Water Infrastructure (WWI) Module of TP-B. The figure shows the existing WWI and natural water courses in the virtual geographic environment including land use data and DEM (data integration by OGS Data Explorer).
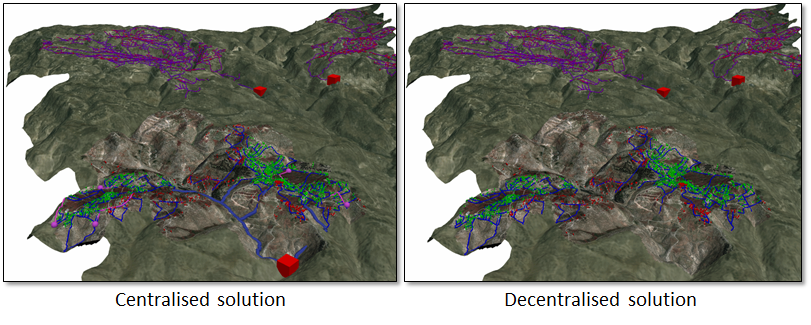
Using the Waste Water Infrastructure Module, optimal solutions for centralized or decentralized waste water treatment can be designed. Connection of buildings in rural area to sewer system using a centralised and a decentralised scenario are compared (green buildings are connected, red ones are not). In this case, the centralised approach has much higher costs for building and maintenance of the sewer system.


