glUV: A global UV-B radiation dataset for macroecological studies
The following layers cover global land and marine areas and have a spatial resolution of 15 arc-minutes. They are in the latitude / longitude coordinate reference system and the datum is WGS84. The six UV-B (UVB1-UVB6) variables are meant as an extension of the ![]()
![]() existing Bioclim data but being based on UV-B measurements instead of temperature and precipitation. The data are derived from the monthly mean UV-B layers provided below covering the period of 2004-2013. All files are provided in ASCII format.
existing Bioclim data but being based on UV-B measurements instead of temperature and precipitation. The data are derived from the monthly mean UV-B layers provided below covering the period of 2004-2013. All files are provided in ASCII format.
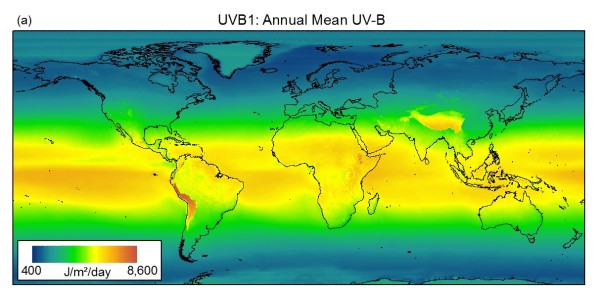
UVB1 - Annual Mean UV-B ![]()
![]() UVB1 (16.7 MB)
UVB1 (16.7 MB)
UVB2 - UV-B Seasonality ![]()
![]() UVB2 (16.7 MB)
UVB2 (16.7 MB)
UVB3 - Mean UV-B of Highest Month ![]()
![]() UVB3 (16 MB)
UVB3 (16 MB)
UVB4 - Mean UV-B of Lowest Month![]()
![]() UVB4 (16.5 MB)
UVB4 (16.5 MB)
UVB5 - Sum of Monthly Mean UV-B during Highest Quarter ![]()
![]() UVB5 (16.4 MB)
UVB5 (16.4 MB)
UVB6 - Sum of Monthly Mean UV-B during Lowest Quarter![]()
![]() UVB6 (16.6 MB)
UVB6 (16.6 MB)
 Example of one UV-B layer: Annual mean UV-B (UVB1)
Monthly Mean UV-B (January - December)
The following layers are daily measurements summarized into monthly mean UV-B Erythemal Daily Dose values and averaged across all years in the period of 2004-2013. These layers cover global land and marine areas and have a spatial resolution of 15 arc-minutes. They are in the latitude / longitude coordinate reference system and the datum is WGS84. All files are provided in ASCII format.
![]()
![]() January (15.4 MB)
January (15.4 MB)![]()
![]() February (16 MB)
February (16 MB)![]()
![]() March (16.7 MB)
March (16.7 MB)![]()
![]() April (16.2 MB)
April (16.2 MB)![]()
![]() May (15.5 MB)
May (15.5 MB)![]()
![]() June (15 MB)
June (15 MB)![]()
![]() July (15.3 MB)
July (15.3 MB)![]()
![]() August (16 MB)
August (16 MB)![]()
![]() September (16.7 MB)
September (16.7 MB)![]()
![]() October (16.3 MB)
October (16.3 MB)![]()
![]() November (15.6 MB)
November (15.6 MB)![]()
![]() December (15.1 MB)
December (15.1 MB)
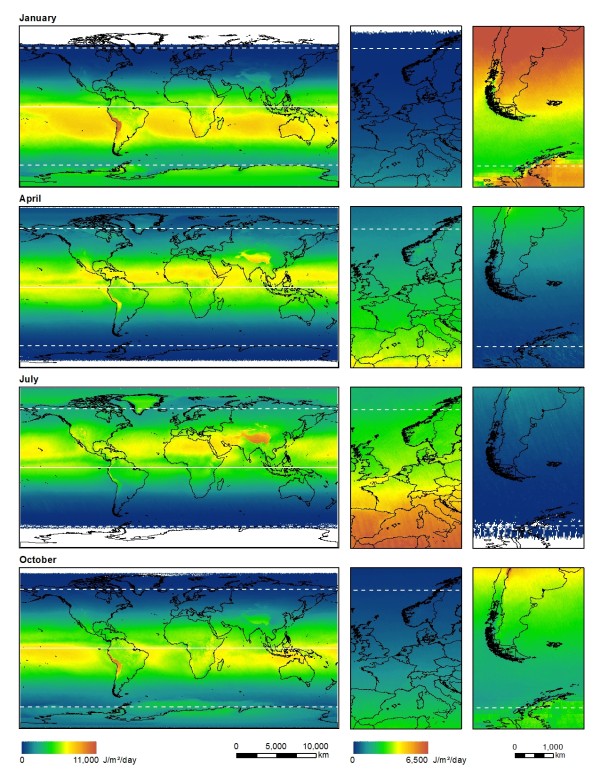
 Examples of four monthly mean UV-B layers: January, April, July, October. The two insets on the right show finer scale variation in the data for the same latitudinal ranges on the northern and southern hemispheres. White areas are caused by the absence of solar radiation due to astronomical polar night and twilight.