
Drought Monitor Germany
Welcome to the UFZ Drought Monitor website!
The UFZ Drought Monitor provides daily information on drought and soil moisture throughout Germany. This information is based on simulations using the mHM meso-scale hydrological model developed at the UFZ (www.ufz.de/mhm).
Updated daily, the maps show you the drought status of the soil in its entirety and the topsoil, which reacts more quickly to recent precipitation, and the water available to plants in the soil.
The explanations relating to the individual maps and a download option can be found in the accordion that can be expanded below each map. In addition to the three maps of Germany, you can also access and download maps of each federal state.
Furthermore, animated maps demonstrate the development of drought over the last 14 days and the development of the quantity of water available to plants in the topsoil.
An evaluation of the second generation operational German drought monitor with a state-of-the-art compilation of observed soil moisture data from 40 locations and four different measurement methods in Germany can be found here.
Contact

Dr. Andreas Marx
Scientific Coordinator Adaptation at the Helmholtz Climate Initiative
Coordinator Climate Office for Central Germany
Phone: 0341 235-1074
andreas.marx@ufz.de
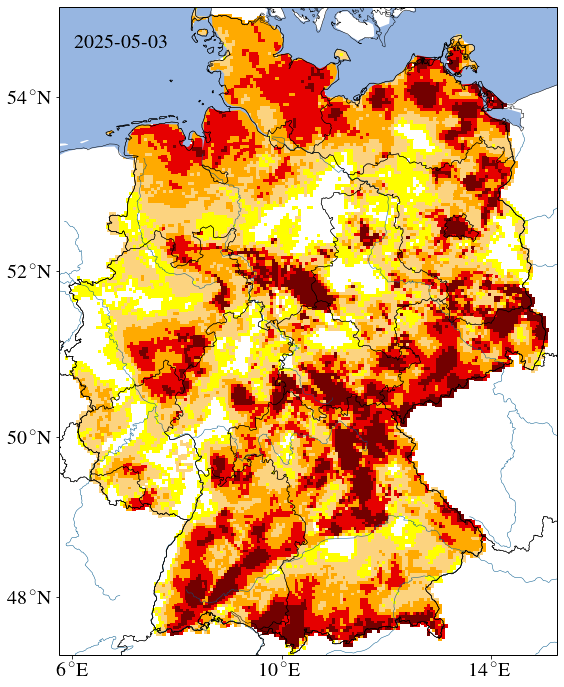
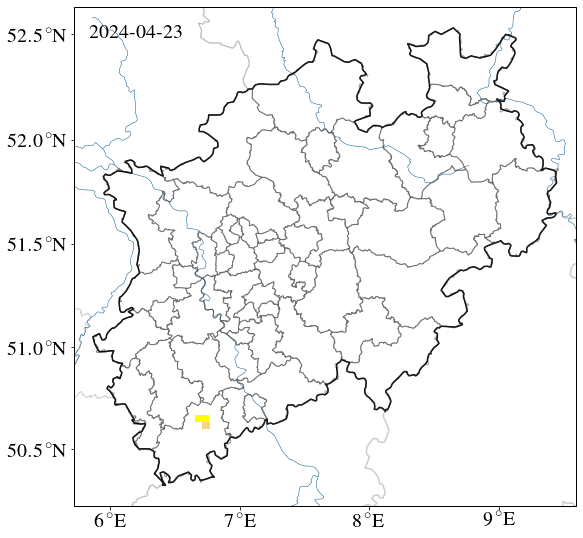
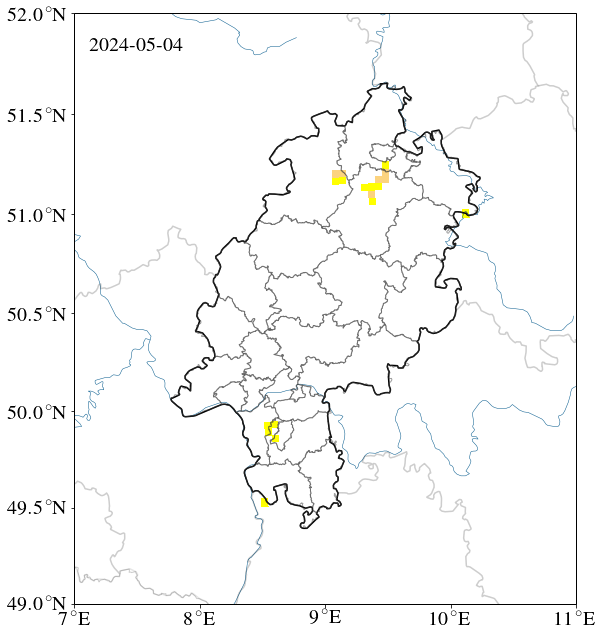
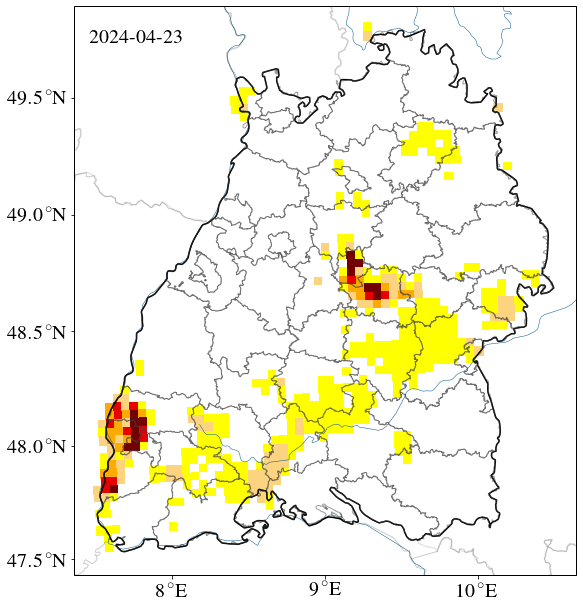
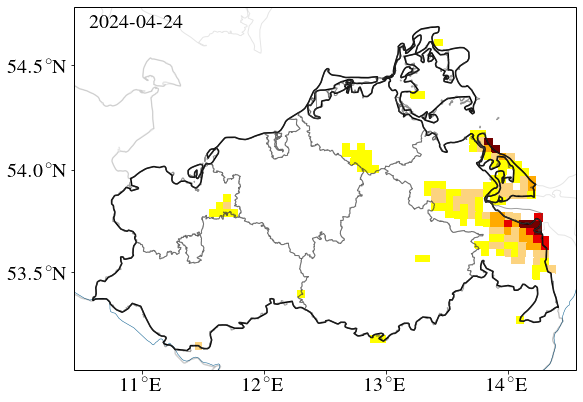
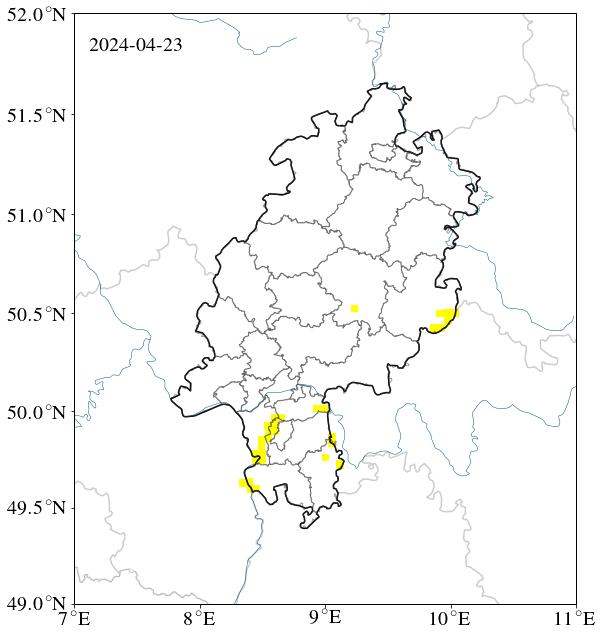
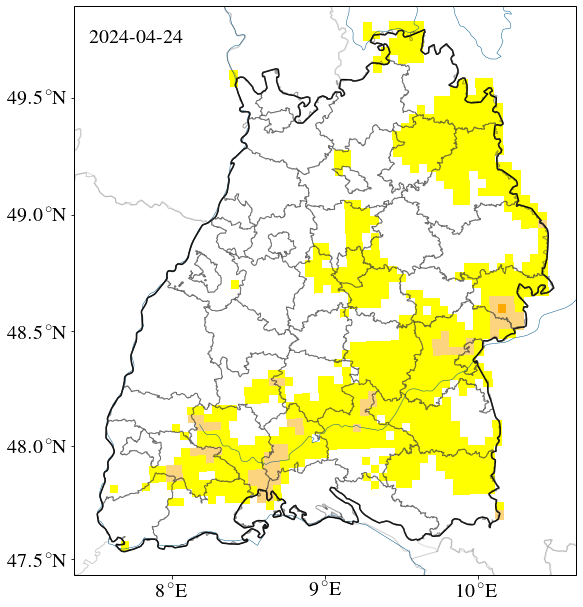
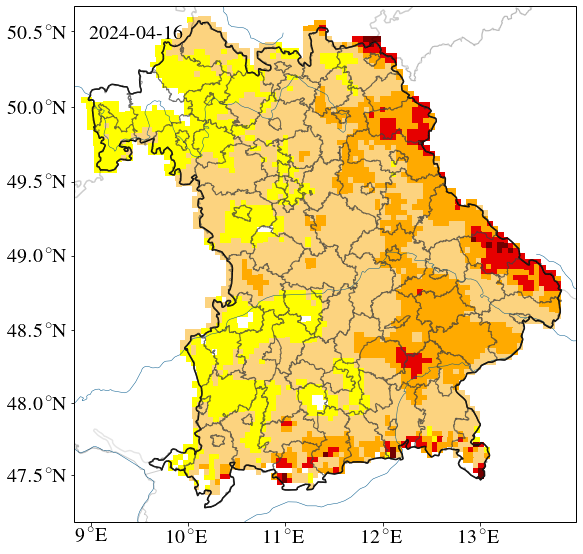
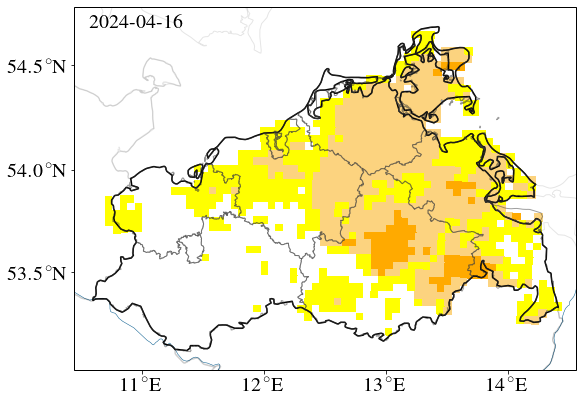
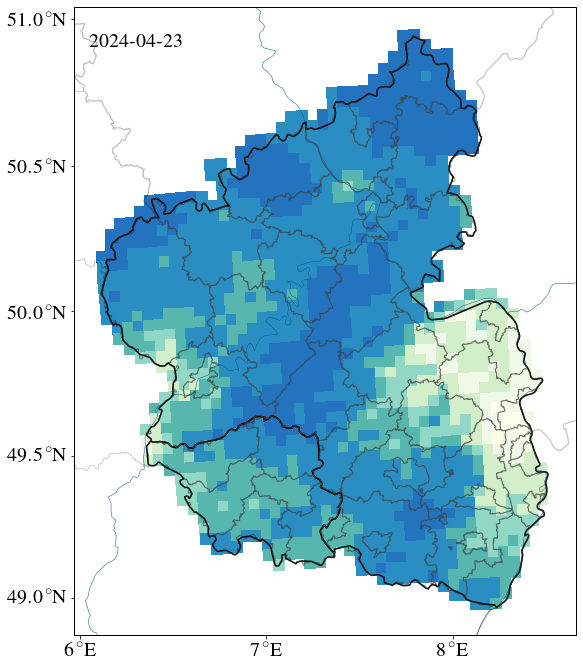
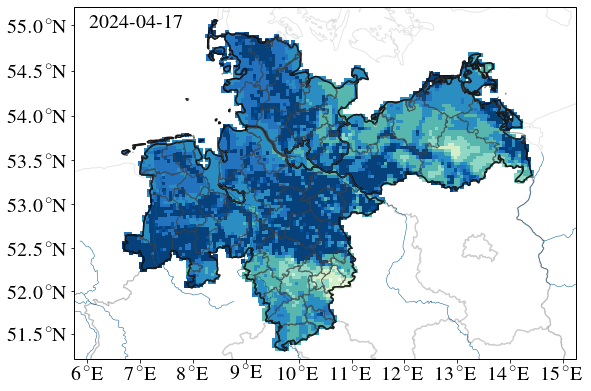
Drought Monitor
Total soil column 1.8 m
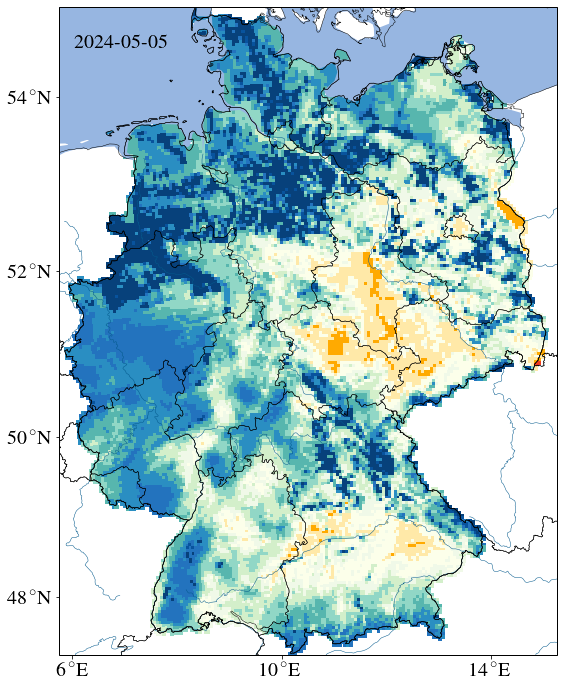
Drought Monitor
topsoil, uppermost 25 cm
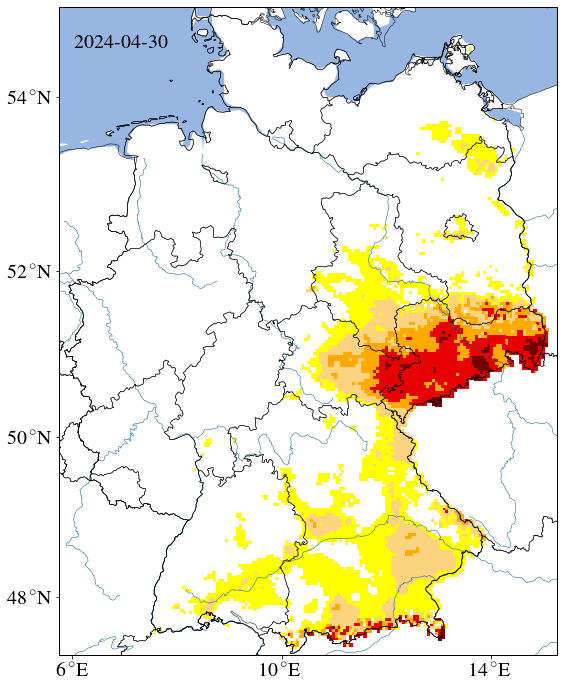
Plant-available water development
uppermost 25 cm

0 %nFK, wilting point
< 30 %nFK, drought stress
< 50 %nFK, incipient drought stress
The meso-scale hydrological model mHM
The scientific base underlying the UFZ Drought Monitor is the hydrological model system mHM (Samaniego et al. 2010, Kumar et al. 2013), which was developed at the UFZ. This “smart” environmental system model is able to mathematically describe ecosystem processes on a landscape-scale and works not only with an extremely good spatial resolution and with high precision but also integrates uncertainties in prediction into its calculations. The model system is not only deployed in the UFZ Drought Monitor but also, to name two examples, in the Copernicus Climate Change Service system ULYSSES and contributes to the WMO state of global water resources report.
The UFZ mHM team received the 2017 UFZ research award for the development of model and its first operationalized application.
Further information is available here: The mesoscale Hydrologic Model mHMThe operational model chain
The Drought Monitor is updated every night. For this purpose, it uses data from around 2500 weather stations operated by the German Meteorological Service (DWD), which is then quality tested and interpolated to the 4 km grid. An external drift kriging approach is applied in this context that uses geographical altitude as additional information. This data is used to drive the mHM hydrological model that simulates soil moisture and other parameters. By comparing the soil moisture with the value expected from long-term data, it is possible to calculate the soil moisture index (SMI, Samaniego et al. 2013) and determine the drought status (see “What is the definition of drought?”)
A more detailed description of the model chain can be found in Marx et al. 2016 and Zink et al. 2016.
Future droughts under climate change
Under the umbrella of the EU’s Copernicus Programme, the EDgE project laid the data foundations for research into future droughts in Europe. Evaluations of hydrological and agricultural droughts for Germany and the federal states can found in this report: HOKLIM brochure. The development of agricultural and hydrological droughts under climate change at a European level have been published in English and can be found at Samaniego und Thober et al. 2018 (agricultural droughts) and Marx et al. 2018 (hydrological droughts).
Terms of use
The rights to the graphics and maps used in the UFZ Drought Monitor are held by the UFZ, unless stated otherwise. The graphics can be used free of charge for scientific and research purposes as well as for editorial purposes subject to the condition that the following note is cited: UFZ Drought Monitor / Helmholtz Centre for Environmental Research.
Download data
Map total soil
Germany
(PNG, PDF)
North Rhine-Westphalia (PNG, PDF) | Hesse (PNG, PDF) | Baden-Württemberg (PNG, PDF) | Bavaria (PNG, PDF) | Mecklenburg-Western Pomerania (PNG, PDF) |Saxony (PNG, PDF) | Saxony-Anhalt (PNG, PDF) |
Thuringia (PNG, PDF) | Berlin + Brandenburg (PNG, PDF) |
Schleswig-Holstein + Hamburg (PNG, PDF) |
Lower Saxony + Bremen (PNG, PDF) | Rhineland-Palatinate + Saarland (PNG, PDF) | Northern Germany (PNG, PDF) | Central Germany (PNG, PDF)
Map soil, uppermost 25 cm
Germany
(PNG, PDF)
North Rhine-Westphalia (PNG, PDF) | Hesse (PNG, PDF) | Baden-Württemberg (PNG, PDF) | Bavaria (PNG, PDF) | Mecklenburg-Western Pomerania (PNG, PDF) |Saxony (PNG, PDF) | Saxony-Anhalt (PNG, PDF) |
Thuringia (PNG, PDF) | Berlin + Brandenburg (PNG, PDF) |
Schleswig-Holstein + Hamburg (PNG, PDF) |
Lower Saxony + Bremen (PNG, PDF) | Rhineland-Palatinate + Saarland (PNG, PDF) | Northern Germany (PNG, PDF) | Central Germany (PNG, PDF)
Map water available to plants
Germany
(PNG, PDF)
North Rhine-Westphalia (PNG, PDF) | Hesse (PNG, PDF) | Baden-Württemberg (PNG, PDF) | Bavaria (PNG, PDF) | Mecklenburg-Western Pomerania (PNG, PDF) |Saxony (PNG, PDF) | Saxony-Anhalt (PNG, PDF) | Thuringia (PNG, PDF) | Berlin + Brandenburg (PNG, PDF) | Schleswig-Holstein + Hamburg (PNG, PDF) | Lower Saxony + Bremen (PNG, PDF) | Rhineland-Palatinate + Saarland (PNG, PDF) | Northern Germany (PNG, PDF) | Central Germany (PNG, PDF)
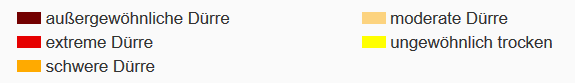
Legends
Total soil column and topsoil (uppermost 25 cm)
plant-available water
Download data
The 1951–2018 SMI data can be downloaded in Netcdf format. The statistical base covers the entire period. The data is based on Zink et al. 2015 (ERL).
The 68-year soil moisture index time series is available, for example, as a daily area dataset and can likewise be made available upon request.
Oberboden bis 25 cm Tiefe:
Soil moisture index_topsoil_monthly_1951_2018 (66 MB)
Gesamtboden:
Soil moisture index_total_soil_monthly_1951_2018 (66.4 MB)
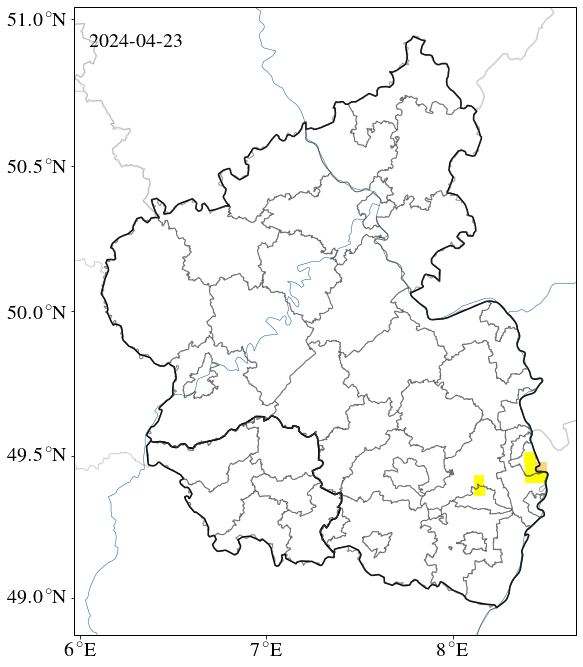
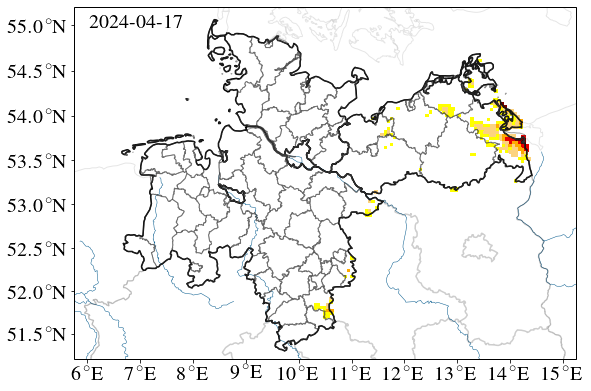
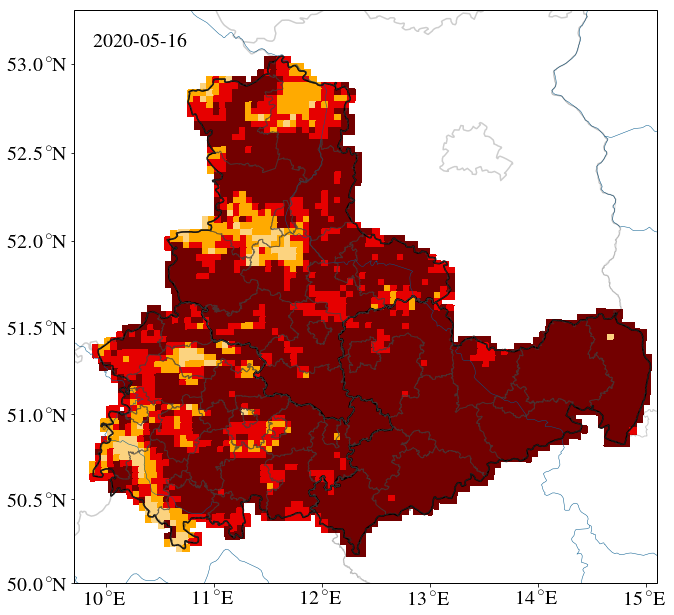
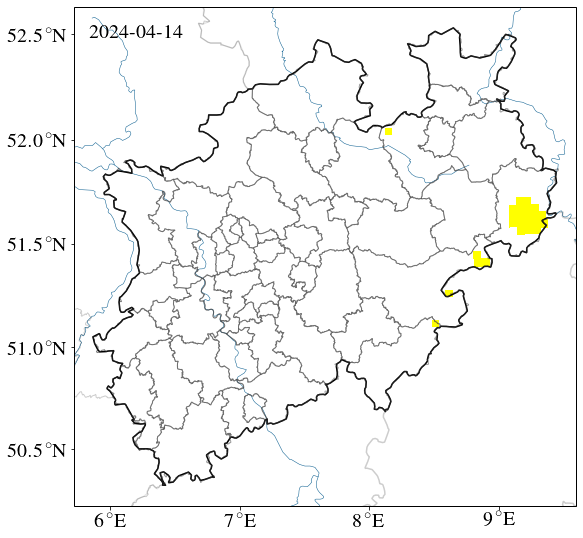
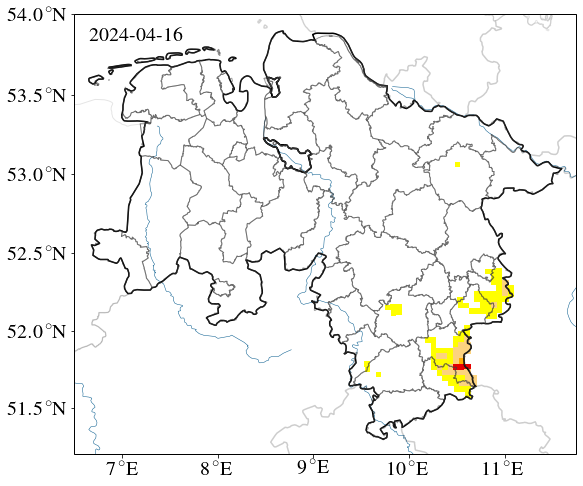
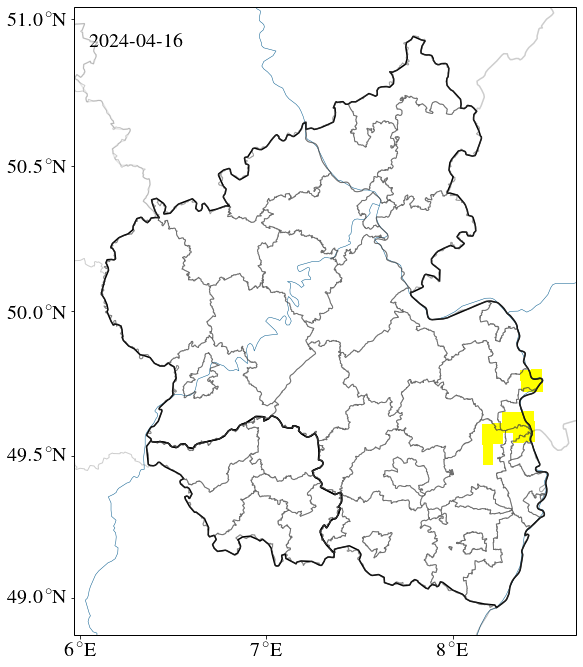
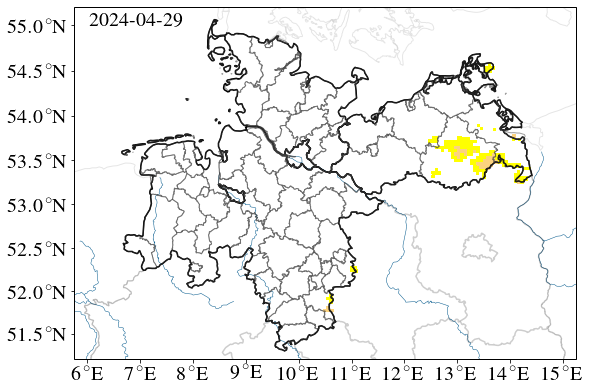
Drought in the total soil column and in the topsoil
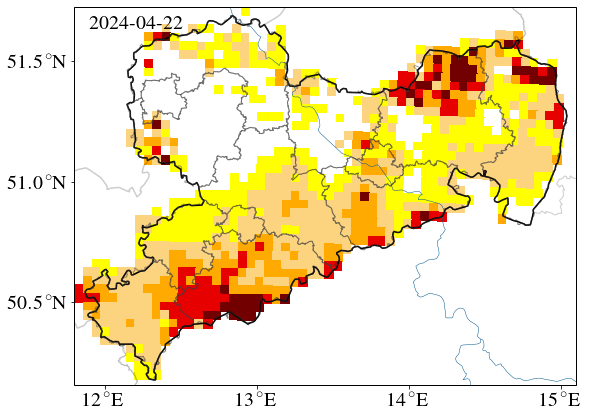
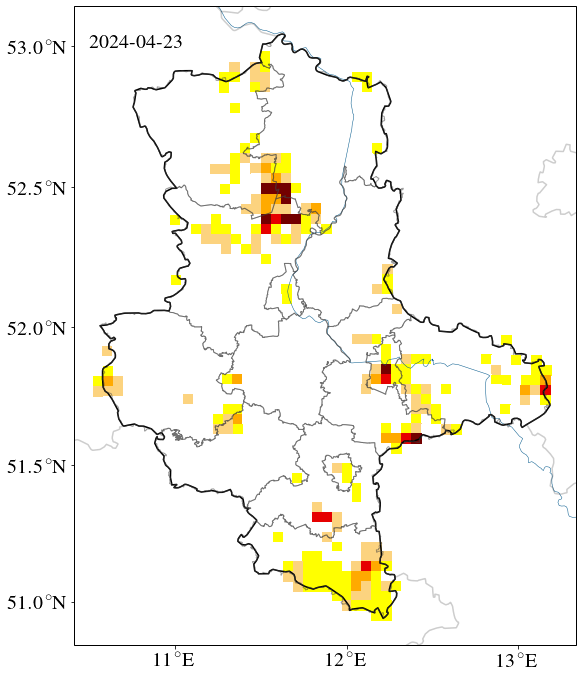
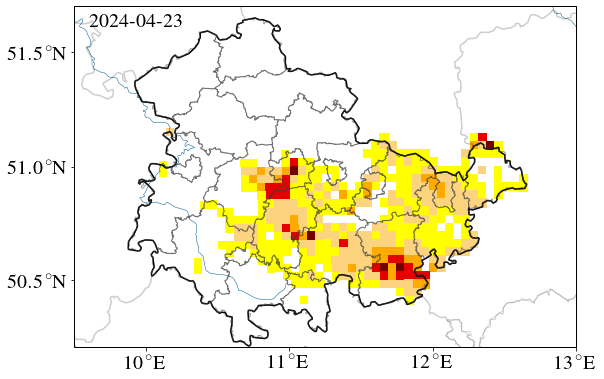
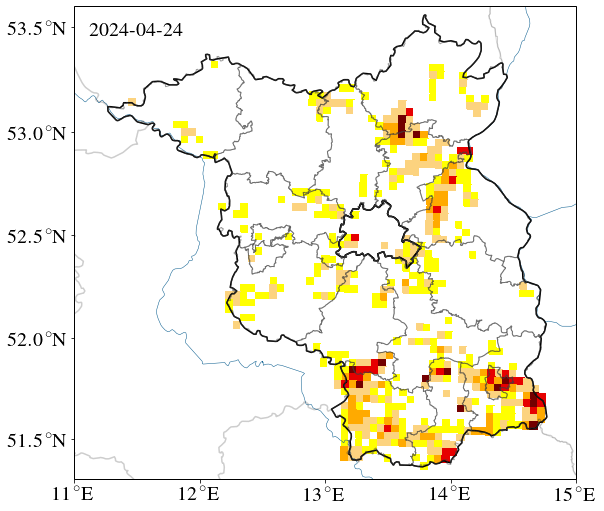
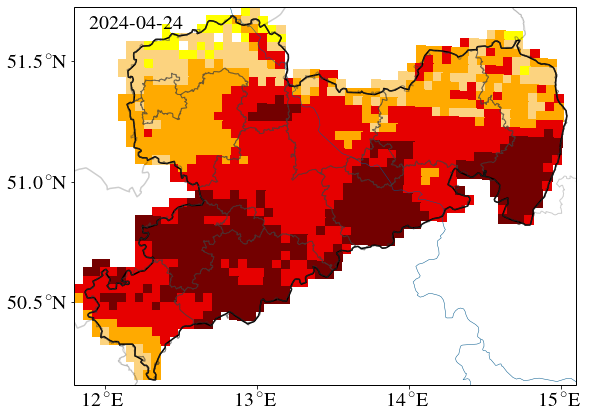
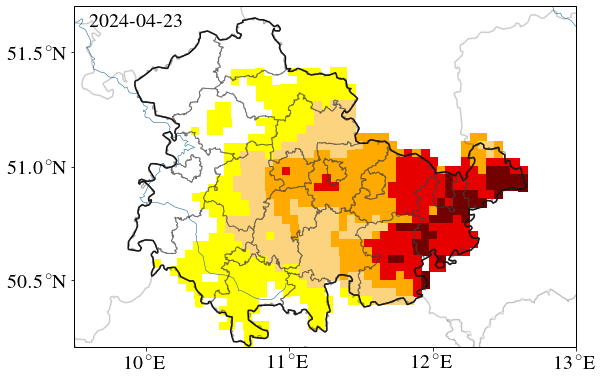
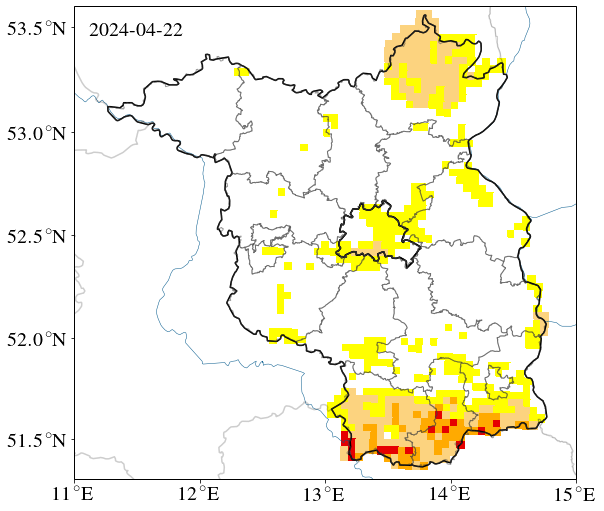
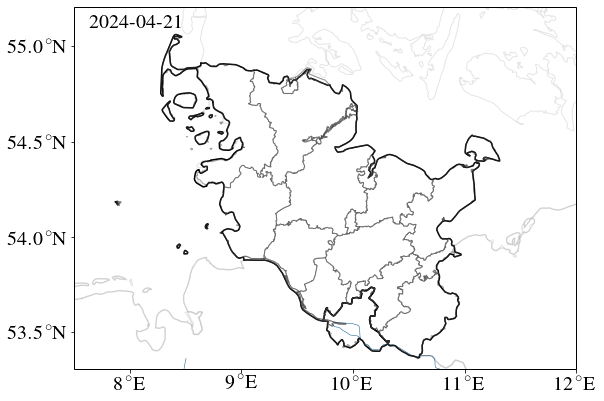
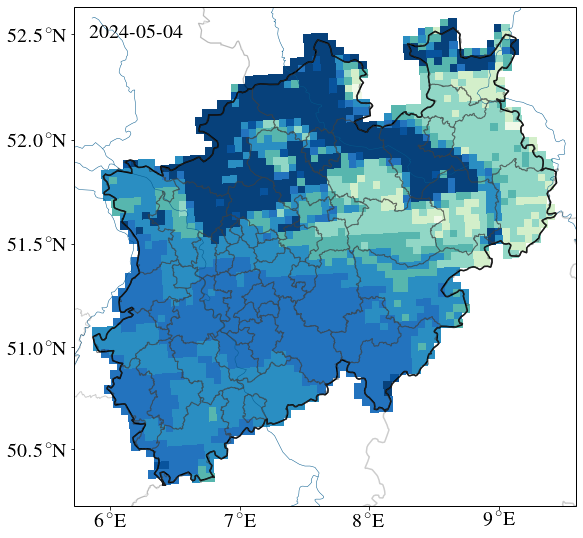
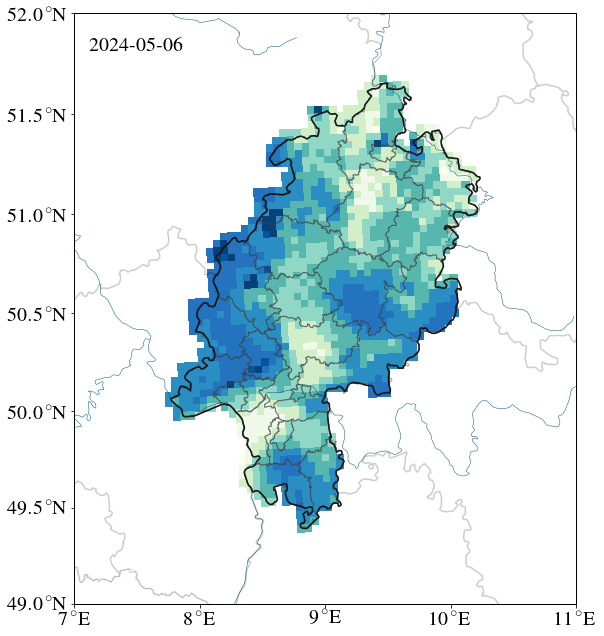
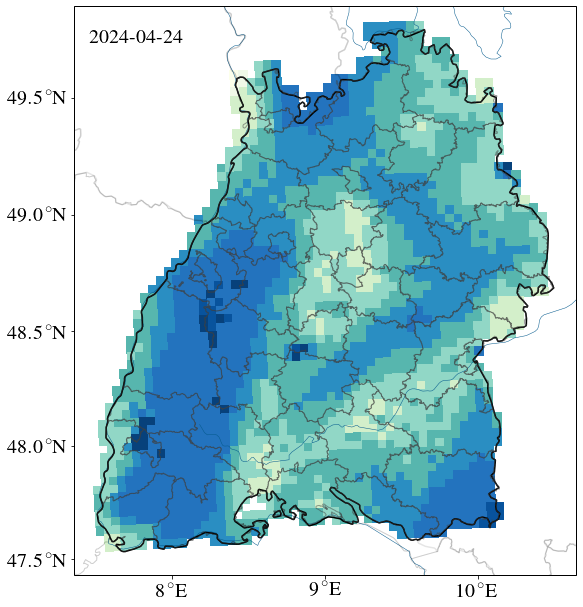
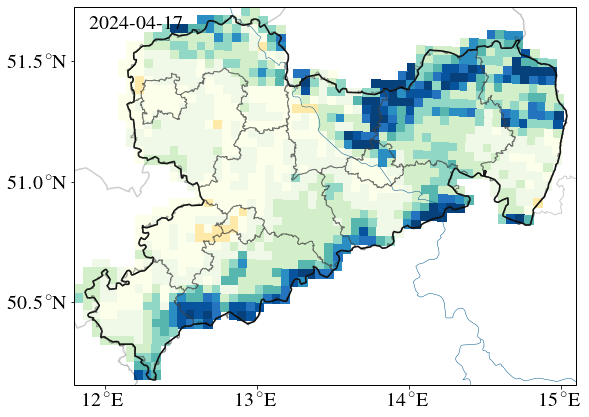
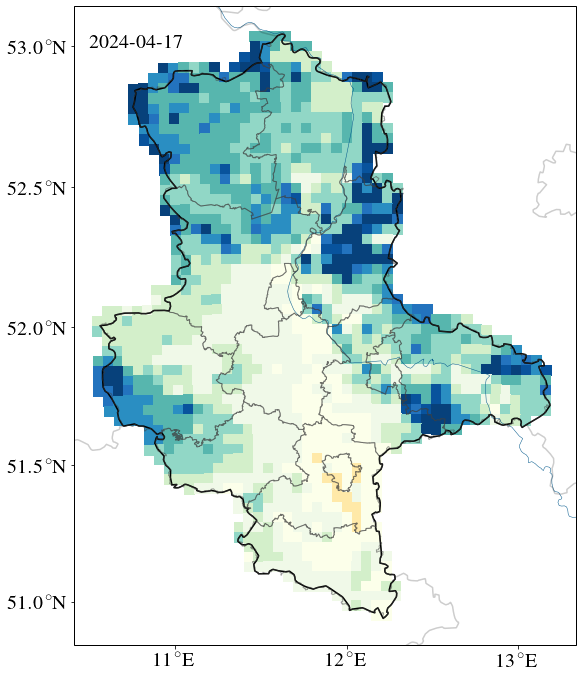
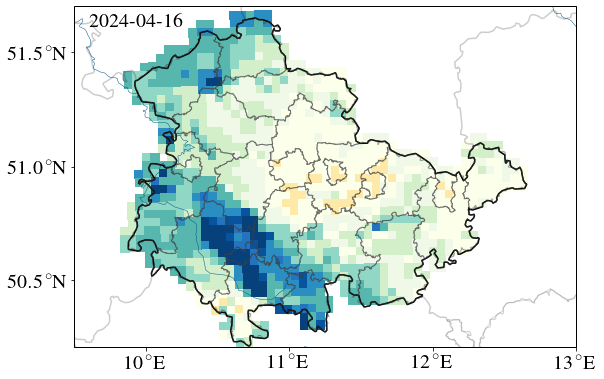
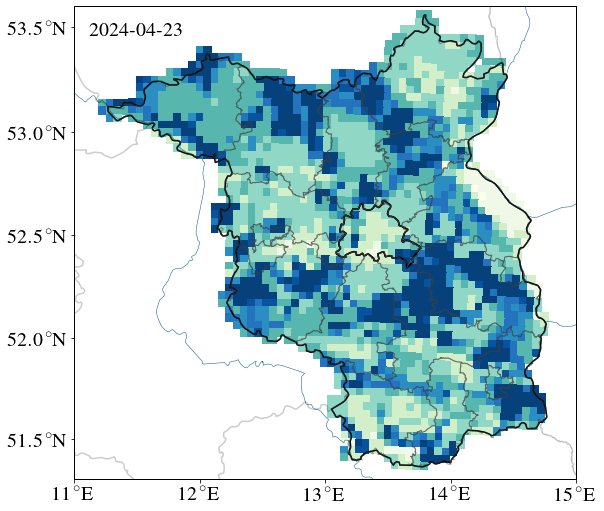
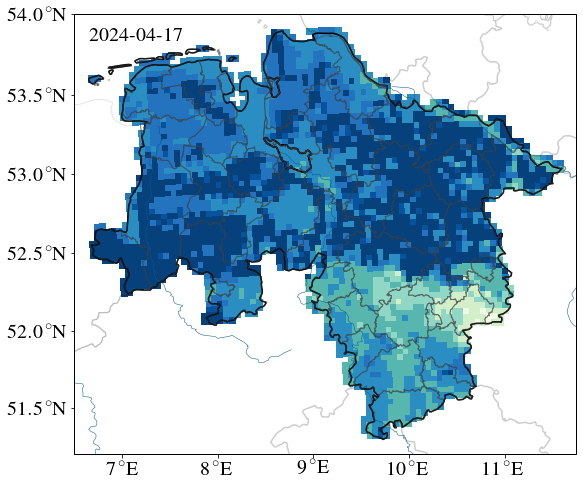
On the drought in the total soil column map, the soil moisture index is presented in 5 classes (4 drought classes and one warning level) at a depth of up to approx. 1.80 metres in each case. The actual soil depth varies widely across Germany and is derived in the mHM model from the soil overview map.
On the topsoil drought map, the soil moisture index of the topsoil is presented in 5 classes at a depth of up to 25 cm.
How is the drought occurence determined?
Drought as a deviation from the value expected from long-term data is estimated using what is known as a percentile approach. This is demonstrated in the graphic below relating to agricultural drought at a location in Brandenburg.

As drought is a comparison to the normal state, a first step involves the referencing of the annual course of soil moisture over the 1951–2015 comparative period (grey lines). The two thick black lines show the range, i.e. the driest and wettest state for each day. In addition, the years 2003 and 2014 are shown in blue and green.
It already becomes apparent from this illustration that soil moisture in Germany is, as a rule, higher in winter than in summer. This is related to the distribution of precipitation over the course of a given year, the very low level of evaporation in winter and the higher intensities of precipitation in the summer.
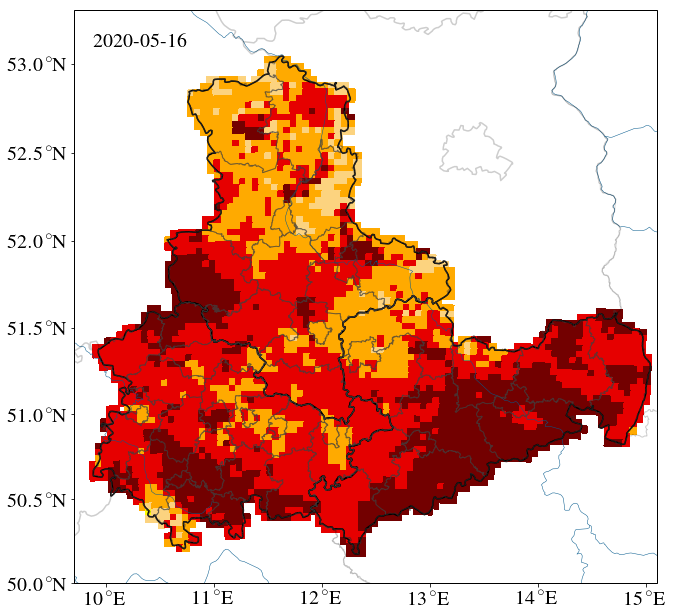
Only when the current soil moisture falls below the 20th percentile in comparison to long-term data, i.e. the value seen in only 20% of the years of a long time series, is it considered to be a drought. The colours indicate the severity of the drought. In this context, the “unusual dryness” designates an early warning stage. The drought classes are based on the soil moisture index (SMI), which is calculated on the basis of the mHM hydrological model and shows the soil moisture distribution over a 65-year period since 1951.
- SMI 0,20 - 0,30 = abnormally dry
- SMI 0,10 - 0,20 = moderate drought
- SMI 0,05 - 0,10 = severe drought
- SMI 0,02 - 0,05 = extreme drought
- SMI 0,00 - 0,02 = exceptional drought
Therefore, a value of 0.3 (abnormanlly dry) means that the current soil moisture is a low as in 30% of the cases from 1951–2015. In the same way, an SMI of 0.02 (exceptionaldrought) means that the value is undershot in only 2% of the simulation values based on long-term data.
The following illustration shows for a location in Brandenburg the soil moisture index for the years 2003 and 2014 as well as the drought classes from the long-term statistics.
 für einen Standort in Brandenburg für die Jahre 2003 und 2014.")
A description of the model chain can be found in Marx et al. 2016 and Zink et al. 2016. The calculations of the SMI soil moisture index (Samaniego et al. 2013, JHM) are performed on the basis of the operational hydrological modelling using mHM ( www.ufz.de/mhm ). In addition, the state of the topsoil at a depth of up to 25 cm is shown; the topsoil reacts more quickly to recent precipitation.
Water available to plants
Soil consists of solid soil particles and the pore volume, which is filled with water or air. The pore volume depends on the soil type, density, granulation and structure, among other factors. Various soils differ in their ability to store water. The smaller the pore space, the better the soil’s capacity to hold water becomes.

Calculation of the plant available water
Field capacity (FC) describes the water content that the soil can hold against gravity (or the water that has not run off after three days). Values in excess of 100 percent are possible because even with a full field capacity the soil is not completely saturated with water as the coarse pores and macro-pores still contain air. Through precipitation the soil can consequently attain a higher water content than determined through field capacity.
Wilting point (WP) describes the point from what that the pore volume contains so little water that plants are no longer able to absorb it.
Plant Available Water (PAW) describes the water content of the soil between the wilting point and field capacity in percent. As soil can absorb more water than can be indicated by field capacity, the possible values range between 0 and (depending on the type of soil) > 250 percent.
The current soil water content (SWC) calculated using the mHM is required for calculation:
PAW [%] = (SWC [mm] - WP [mm]) / (FC [mm] - WP [mm])
The UFZ Drought Monitor uses the daily soil moisture to describe water supplies to plants on the basis of the PAW. The soil layer at a depth of 0–25 cm is used in this context.
The following can be used as reference values for classification of water stress:
<50% PAW: agricultural irrigation necessary for optimum harvest yield
<30% PAW: plant water stress.
These assessments vary depending on the plant type and the deposit density of the soil, among other factors.
Development of the last 14 days - animated maps
Drought development
Total soil colum
Drought development
topsoil, uppermost 25 cm
Plant-available water development
uppermost 25 cm

0 %nFK, wilting point
< 30 %nFK, drought stress
< 50 %nFK, exceptional drought
Drought development over the past year
Here you can access the archive of the drought development since 2014.
Publications

Effects of global warming on hydrological and agricultural droughts and floods (German version)

UFZ Newsletter UmweltPerspektiven "Durstiges Europa" (German version)
Podcasts
Age of drought - Modelling of extreme weather phenomena (german version)
Drought photographs
Dry fields, riverbeds or forests: Heat records are being seen in many places in Germany. Do you have any photographs of drought that you would like to share with us? Here, you can find out how
Simply upload your photo in the following form:
Form drought photos
Acknowledgements
We express our thanks to the German Meteorological Service (DWD) for providing us with current weather data on a daily basis. Furthermore, we would like to thank the European Environment Agency (EEA), the Federal Institute for Geosciences and Natural Resources (BGR), the Federal Agency for Cartography and Geodesy (BKG), the European Water Archive, the Federal Institute of Hydrology (BfG), NASA (National Aeronautics and Space Administration) and the Global Runoff Data Centre for the data that is incorporated into the Drought Monitor.
The work for some of the underlying projects was carried out under the auspices of the Helmholtz Climate Initiative and REKLIM.
Our special thanks go out to Ben Langenberg, Martin Abbrent and Sven Petruschke (WKDV) for their assistance with the Linux cluster and with technical implementation of the homepage.