Example Lany
Hypothesis:
Derived soil texture properties, from geophysical measurements, support modelling of different SOM indicators to assess agricultural management.
Investigation area:
The modelling procedure will be described for the example of the field site Lany with a total area of 21 ha which is located in the central part of the Czech Republic (50°08’N, 13°52’E). It represents arable land with rape, spring barley, winter wheat and corn on Haplic Cambisol with an average annual temperature of 7.8 °C and 450 mm of annual precipitation.
Methods:
The model CANDY requires a complete set of soil physical parameters for the rooted soil profile but it may use pedotransfer functions in order to fill gaps in the soil input data basing on data about soil texture and SOC:
• Bulk density (BD)= function of clay, SOC
• Particle density (PD)= function of clay, SOC
• Pore volume (PV)= function of BD, PD
• Texture interpolation after Nemes et al. (1999)
• Field capacity (FC)= function of particles<= 20µm
• Permanent wilting point (PWP)= functions of clay
• Saturated conductivity (ks)= functions of clay, sand (USDA7)
• Long term stabilized SOC after Kuka (2005)= functions of PV,FC,PWP
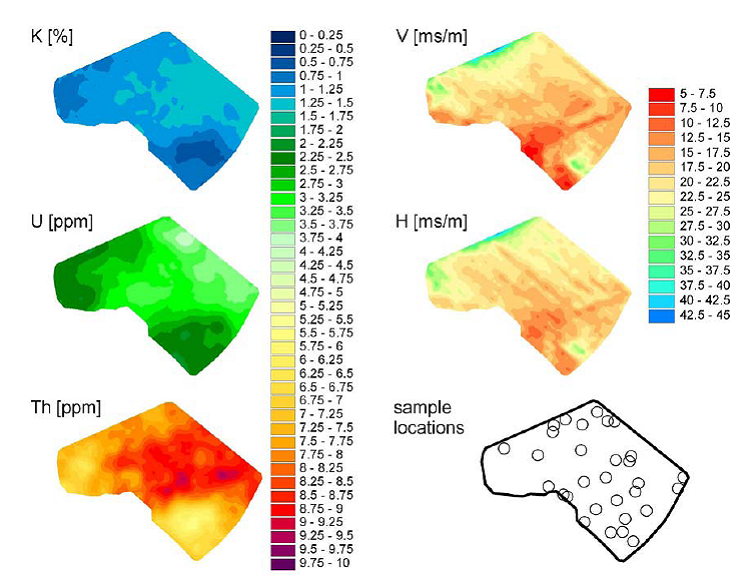
Digital soil mapping based on Support Vector Machines regressions (Viscarra-Rossel & Behrens, 2010) between measured soil properties and interpolated data from combined collection of geophysical measurements (EM38 and gamma spectrometry) (see Fig. 1) with mobile sensor platforms provided data about clay, silt and sand as well as SOC for three soil layers (0-10 cm, 10-30 cm, and 30-70 cm).


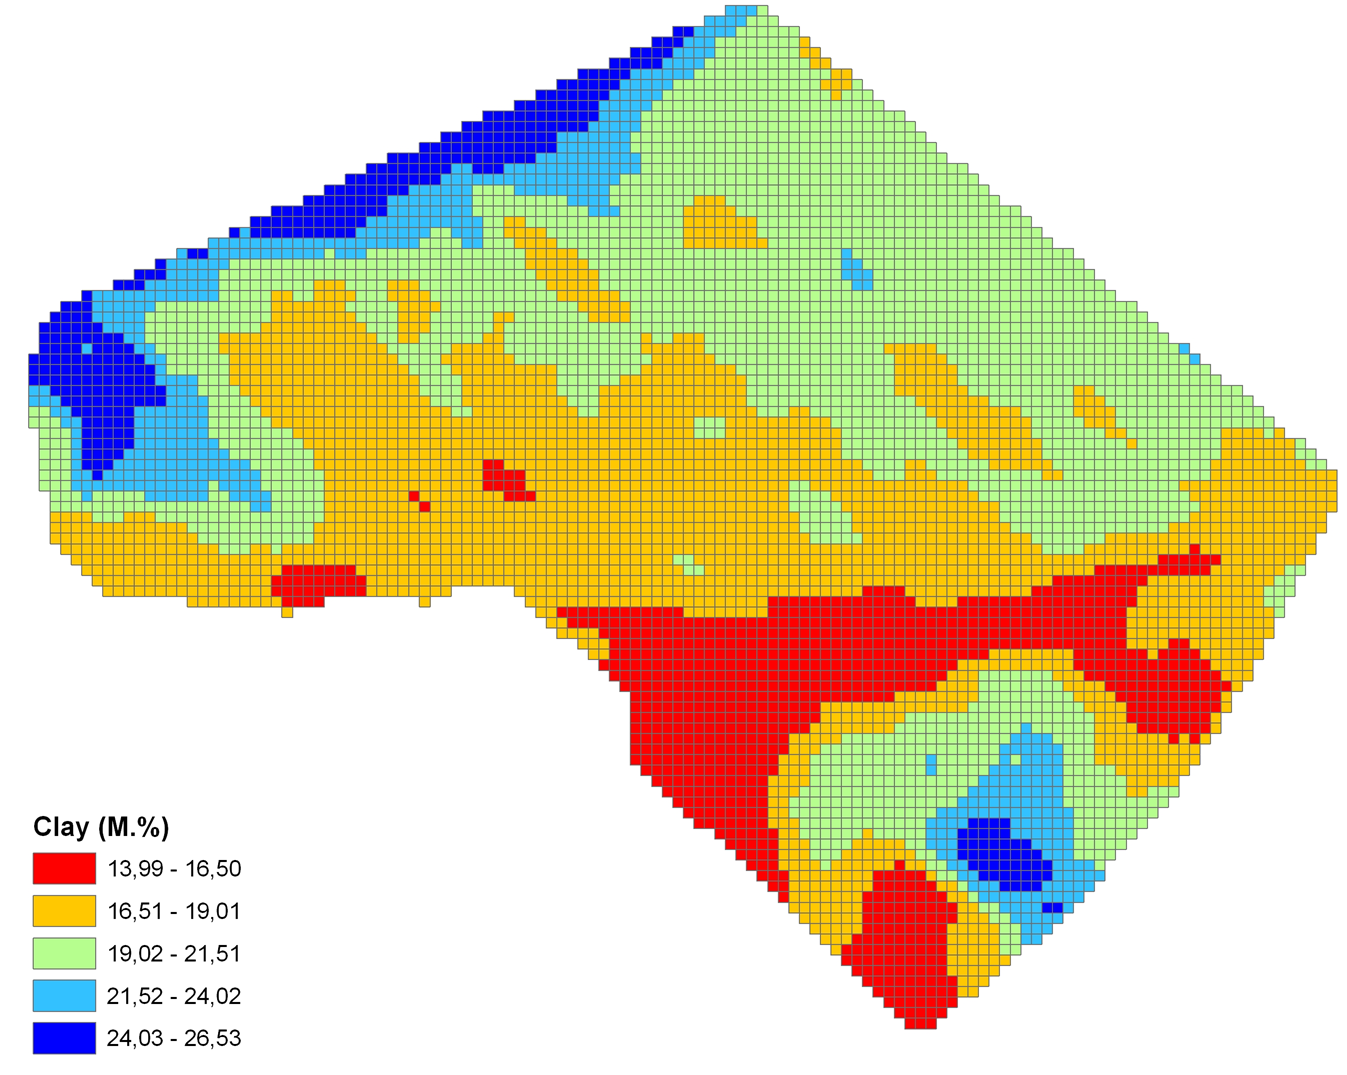
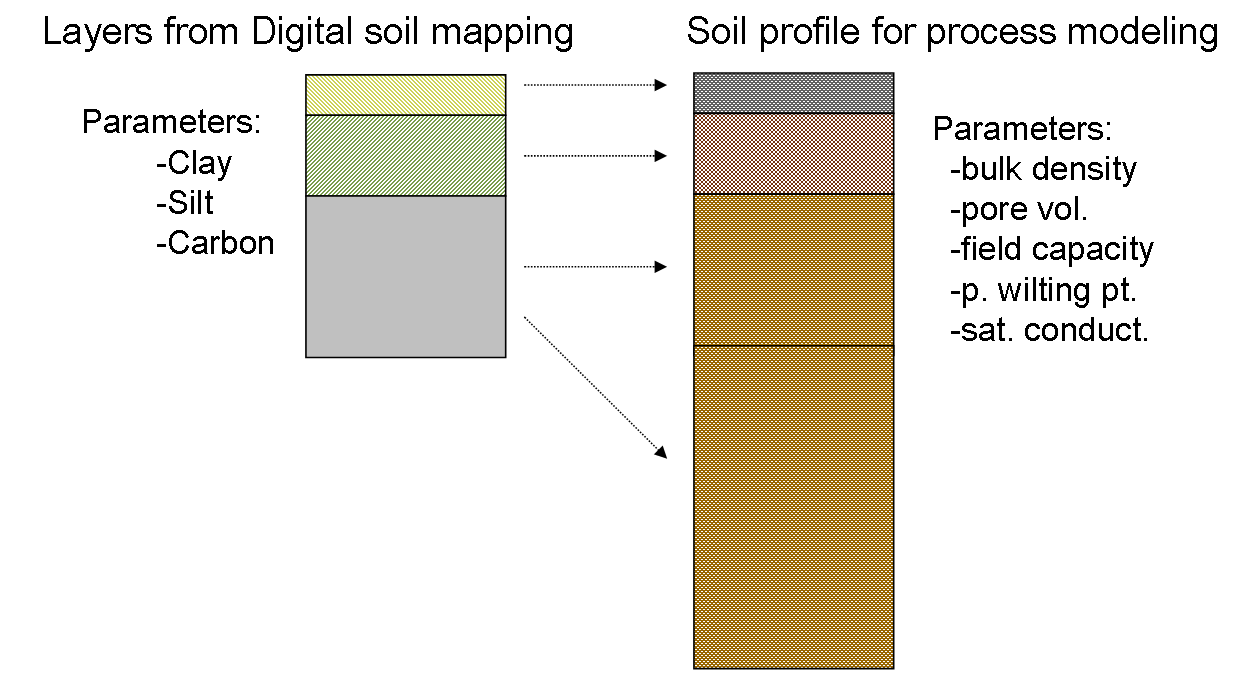
Based on the data of clay (see Fig. 2), silt, and SOC maps a pre-processing step produces for each raster grid a complete set of mentioned soil parameters with pedotransfer functions as model inputs for process modelling. For the construction of the rooted soil profile we enlarged the last soil layer up to 150 cm (see Fig. 3).

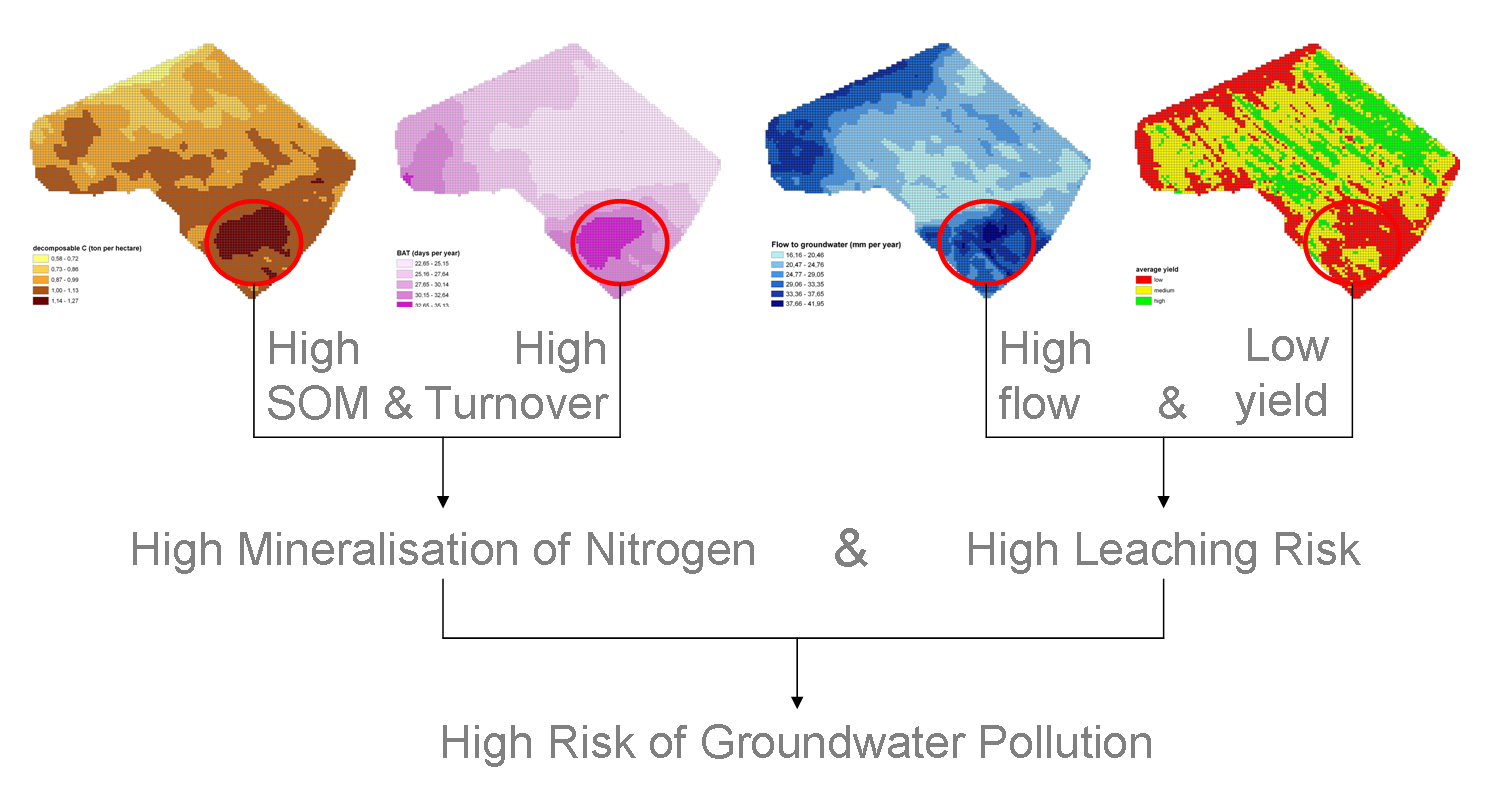
The combination of the CANDY modelling results delivers the following insights for the field site Lany (see Fig. 4):
First two maps show soil organic matter in topsoil and its turnover condition in Lany. Obviously both maps are characterised by a hot spot in the southern part and that could result in a high mineralization of nitrogen. The blue coloured map illustrates the before mentioned flow to groundwater. Additional information was the distribution of average yield of the field site. It was calculated from high-resolution measured values (average from five years). In the hot spot area (marked with a red circle) a high flow to groundwater and low yield is detected. This indicates a high leaching risk. The combination of high mineralization and leaching implies a high risk of groundwater pollution. With this insight the reduction of SOM reproduction need to be recommended for this field area.

