Cytometric Barcoding (CyBar)
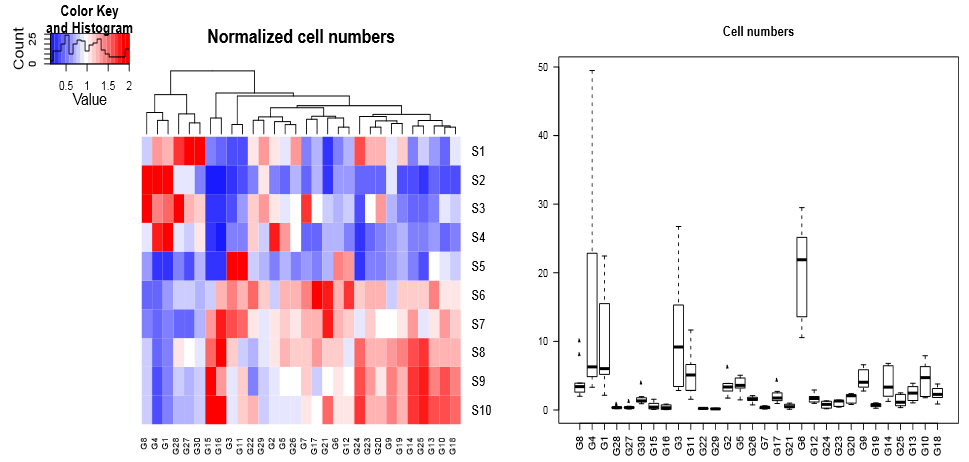
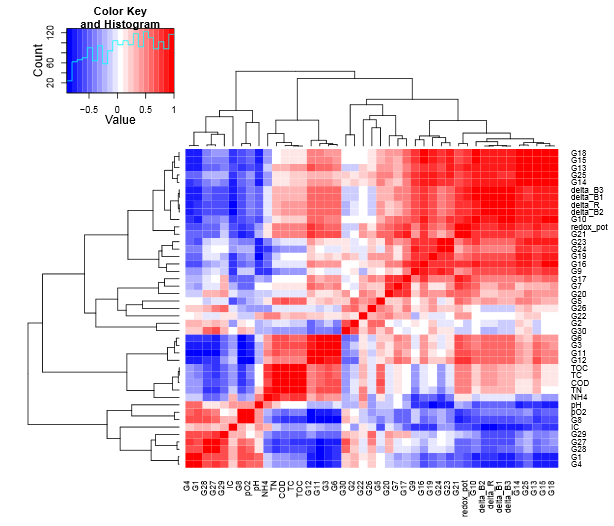
CyBar performs a segregated analysis of cell abundance changes in subcommunities. All subcommunities in the histograms are marked with a gate and the combined gate template finally applied to all samples. The extracted cell abundances and their dynamics can be visualized in the CyBar plot enabling direct comparison of abundance variation over time and between differently treated samples. In addition, correlation analysis can reveal correlations between abiotic (experimental) and biotic (cell abundance) parameters.
The R-package flowCyBar (including an instruction manual) is deposited at the Bioconductor platform and can be downloaded
here
.


Original publications:
Koch C, Günther S, Desta AF, Hübschmann T, Müller S. Cytometric fingerprinting for analysing microbial intra-community structure variation and identifying sub-community function. Nature Protocols (2013) 8(1), 190-202.
Günther S, Koch C, Hübschmann T, Röske I, Müller RA, Bley T, Harms H, Müller S. Correlation of community dynamics and process parameters as a tool for the prediction of the stability of wastewater treatment. Environmental Science and Technology (2012) 46(1), 84-92.
