Comparison of two extreme flood events in Germany in 2002 and 2013
Matthias Zink, Stephan Thober, Rohini Kumar, Luis Samaniego
Weather situation

The flood event in May/June 2013 has been triggered by high intensive precipitation events. This heavy rain was caused by a low pressure system which is called "Tief Mitteleuropa (Tm)". The atmospheric conditions for this event are comparable to those taking place in August 2002 ("Vb Wetterlage”) which did lead to an extensive flood event, too. These low pressure systems are characterized by very intensive precipitation events over Central Europe, because they take in a lot of moisture during their course over the Mediterranean. At some meteorological stations precipitation sums (sum of 90 hours) which occur once in 100 years have been observed.
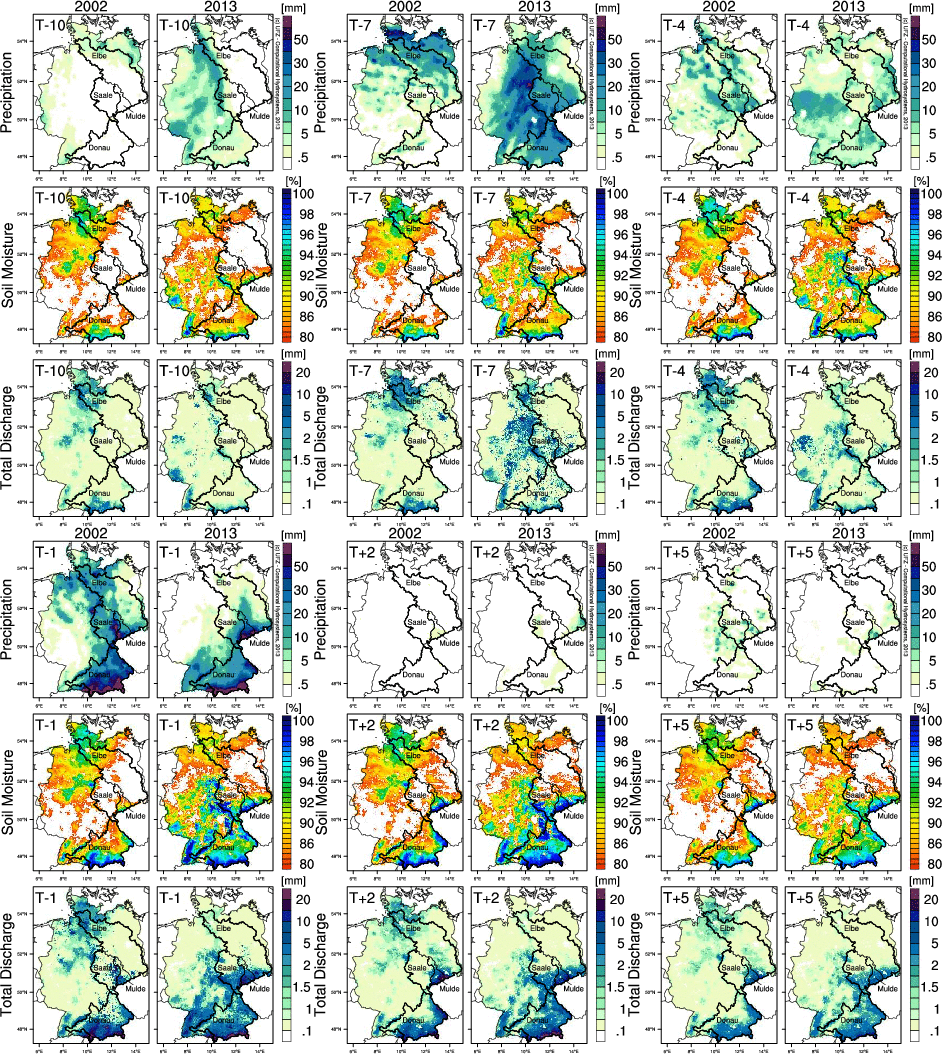
The development of the precipitation over Germany 10 days before (T-10) until 5 days after (T+5) the heaviest precipitation is shown in the top row of Fig. 1. On the left you can see the event of 2002, while on the right-hand side the event 2013 is displayed. As can be seen the most extensive precipitation toke place in the Alps, the foothills of the Bavarian Alps and within Saxony in both events.
State of the Soil
The model simulations of the mesoscale hydrologic model mHM provide information about the spatial and temporal distribution of soil moisture and total discharge. The total discharge describes the amount of water, generated on the corresponding model grid cell. It thus represents the portion of precipitation that is distributed with a certain time delay into the stream. Soil moisture is described as a percentage value between 0% and 100%, where 0% means completely dry soil and 100% describes the maximum soil moisture. It is calculated from the ratio of the actual amount of water in the soil and the maximum possible amount of water in the soil.
The soil moisture is displayed in the middle row of Figure 2. While the soil moisture did not exceed values of 80% previous to the flood event of 2002 in the affected regions (Saxony, eastern Thuringia, southern Saxony- Anhalt, foothills of the Bavarian Alps, and Bavarian Alps), the soil moisture values in 2013 were already considered moist to very moist previous to the flood events. We observed in our model simulations soil moisture values that were approximately 10% higher than the values in 2002 even before the high impact precipitation events started. These moist preconditions in 2013 were increased by rainfall events in the days before the 02.06.2013, which measured the highest precipitation. At the time of the highest precipitation events, the soil moisture values in the Ore Mountains and the Bavarian Alps were similar for both events, but the extension of the areas with very high soil moisture values were significantly higher in 2013. Respectively, the soil in south Saxony, the Franconian and Swabian Alps as well as in the Thuringian Forest was completely saturated with water in 2013.
Statistical characteristics of the generated discharge

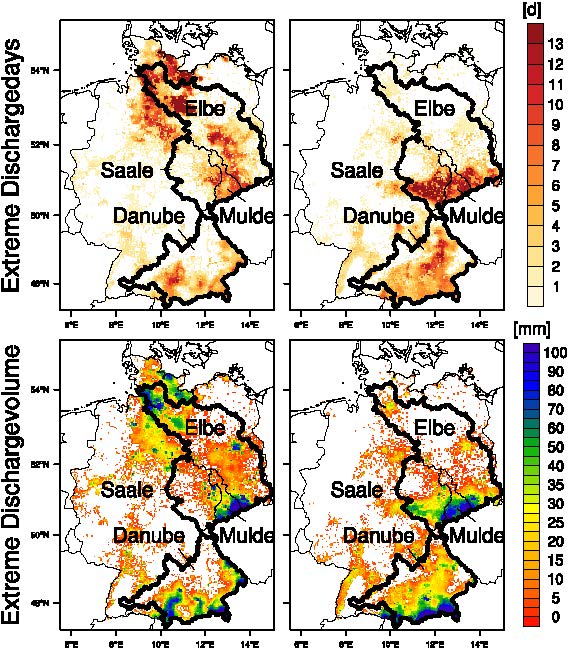
The upper row in Figure 3 depicts the number of days on which the total runoff during the two events in 2002 (left panel) and 2013 (right panel) exceed the value that statistically occurs at 1 % of all days. This reference value was calculated from daily total runoff values during the period from 1950 to 2001. The higher these values are, the more often an exceptional high runoff value occurred at the corresponding model grid cells at these days that later contributed to the flood wave in the river.
The lower row in Figure 3 shows the sum of the generated runoff for each model grid cell during these days for the 2002 event (left panel) and 2013 event (right panel).
The comparison of the two events in 2002 and 2013 shows that the area with a high amount of extreme runoff days in the headwater region of the rivers Mulde (Ore Mountains) and Saale ( Fichtel Mountains and Vogtland) were higher for the event in 2013 than for the flood event in 2002. The discharge volume is very high in these regions. The spatial distribution of the extreme runoff shows that the Saale played a significant role in the development of the flood event of 2013 in the river Elbe, while the Saale played only a minor role in the flood development in 2002.


